Author


The alternative financial services (AFS) industry has attracted a lot of attention lately. Virtually nonexistent in this country 20 years ago, it has grown into a $100 billion business. Since the mid-1990s, the number of payday lenders nationwide has grown over 10 percent annually.
There's another reason why payday lenders, check-cashing outlets and other types of AFS businesses—also called “fringe banking”—have come under scrutiny: a perception that they're primarily used by people who lack physical access to traditional financial services such as banks and credit unions. Otherwise, why would anyone pay the relatively high fees charged for these services? (For more on the industry, see the July 2004 fedgazette.)
A study published in January 2008 by the Brookings Institution, a public policy think tank based in Washington, D.C., examined this notion that AFS exploits the geographically unfortunate. Brookings researchers looked at tract data from the U.S. Census Bureau to compare the locations of AFS providers with those of banks and credit unions. Their findings undermined the idea that AFS customers lack neighborhood access to standard banking services. Over 90 percent of AFS providers are located less than a mile from a bank or credit union branch, for example.
"It's not the case that nonbank financial service firms are filling in a geographic vacuum created from the absence of banks or credit unions," said Matt Fellowes, a researcher now with Pew Charitable Trusts who co-wrote the Brookings study.
If so, where are AFS businesses located? Do they gravitate to areas where potential customers live or work? To shed light on this question, the fedgazette examined county-level data for the Ninth District from the data set used in the Brookings study. Our analysis looked for links between the location of AFS businesses and the characteristics of nearby populations.
The results show that AFS providers—consciously or not—tend to concentrate in counties with higher-than-average poverty rates, lower incomes and relatively large populations of non-U.S. citizens and single parents. This pattern sets the AFS industry apart from traditional financial services; these businesses appear to cater to different segments of the population with distinct financial preferences.
Portrait of the unbanked
Most of what's known about AFS usage comes from user surveys. It's difficult to generalize about AFS customers from these surveys, Fellowes notes; some users believe they don't qualify for a bank account, while others prefer to pay their bills with cash or money orders. Still others simply don't trust banks. "There are many reasons," he said, "that lead families to these nonbank financial services."
Nevertheless, AFS users tend to fall into certain demographic groups. AFS clients on average have low education levels, and while they typically have jobs (you need a paycheck to get a cash advance or a short-term loan), their household incomes are lower than the national median. Further, studies have shown that AFS are more likely to be used by single parents and by immigrants.
If AFS use is associated with certain demographic groups, one might expect AFS businesses to cluster in areas with relatively high concentrations of those groups. The fedgazette searched for such a pattern in the Brookings data on the location of AFS providers in the district.
For each district county, the Brookings data record the number of check-cashing, payday-lending and pawnbroker locations, as well as the number of bank and credit union branches (due to a confidentiality agreement, Brookings couldn't provide data below the county level). Brookings researchers also compiled an index to account for AFS locations providing multiple services under one roof. For example, a pawnshop that offers payday loans and cashes checks counts in the index as one location, not three.
This county-level data can be compared with demographic statistics from the most recent census to see whether AFS providers are more likely to be found in counties with higher poverty rates, lower median incomes or other characteristics associated with AFS use.
In the distribution of AFS providers, at least one AFS facility can be found in 135 of 303 district counties. Many district counties are too small to have much of a financial services sector, yet quite a few counties of small to moderate size-those with populations between 5,000 and 20,000-do have AFS facilities. Four sparsely populated or very poor counties in the district have no financial services providers at all.
Population is clearly the most important factor driving the location of AFS providers in the district, but it isn't the only one.
Going to the customer
Because population is so strongly linked to AFS concentration, it can drown out other key demographic factors such as income and educational attainment. To focus on these other potential influences on AFS location, the fedgazette developed an index of AFS market share. The ratio of AFS locations to the total number of financial services providers gives a rough measure of AFS presence in a given county, regardless of its population.
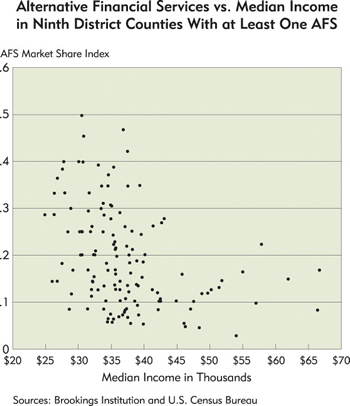
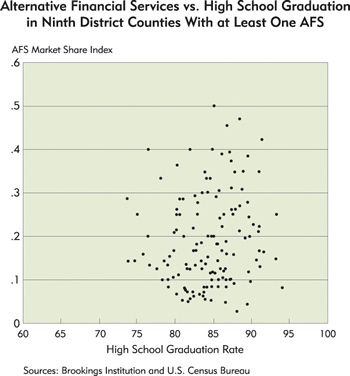
This AFS index was then compared with demographic indicators that, based on the user surveys, one would expect to be associated with AFS customers. In each county, correlations with poverty rate, median income, years of education, foreign-born population and single parenthood were examined. The results mostly confirmed the findings of user surveys (see charts) although the data yielded some surprises.

The demographic factor most strongly associated with the AFS index is poverty. The higher a county's poverty rate, the higher its AFS market share. For example, Hill County, Mont., has a poverty rate nearly 40 percent above the national average—and the district's third highest AFS market share.
Whether this relationship indicates that people living below the poverty line are heavier users of AFS is unclear, since user surveys focus mainly on income rather than poverty status. What is clear is that AFS businesses cluster in areas of the district with disproportionately large numbers of poor households.
Household income is inversely related to the AFS index; the higher a county's median household income, the smaller its share of AFS providers. Considering that AFS clients typically earn less money than users of traditional banking services, this would be expected if AFS providers were establishing or expanding operations to serve lower-income customers.
Another strong predictor of AFS location is the proportion of households in a county headed by single parents. AFS providers are found in counties with a higher-than-average rate of single parenthood-understandable because families with only one wage earner may have trouble stretching their budgets until the next payday. A loan from a payday lender or pawnbroker can help make ends meet.
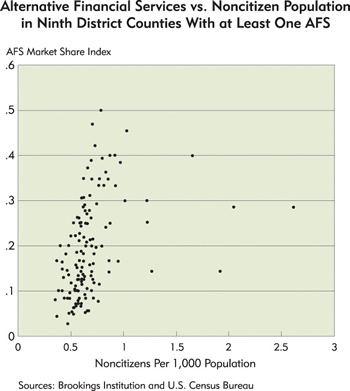
The link between immigrant population and AFS distribution isn't as simple as it appears at first glance. According to user surveys, a larger share of AFS users are foreign-born than native-born; many immigrants distrust banks because of poor experiences with financial institutions in their home countries. But in this analysis, the connection between AFS market share and the size of a county's immigrant population is weak.
However, the correlation between AFS location and the relative size of a county's noncitizen population is much stronger. Possibly—although there's no evidence for this in user surveys—more recent immigrants who have not yet become U.S. citizens have lower incomes and are less familiar with banks than the immigrant population as a whole.
As interesting as what this analysis found is what it didn't: Contrary to user surveys indicating that AFS users often have low education levels (less-educated workers typically earn lower incomes), the association between AFS location and educational attainment, measured by high schooland college graduation rates, is very weak. One possible explanation is that high school graduation rates vary little from one county to the next, making it difficult to correlate those differences with AFS market share.
Serving different needs
The lack of an obvious link between AFS location and education raises the question of causation. Just because two sets of data are correlated doesn't mean that one has anything to do with the other. Could the demographic patterns in the Brookings data have less to do with the distribution of AFS providers than with other factors, such as differences in state regulations or location trends in the financial services industry as a whole?
In principle, stricter state regulation of the AFS industry would reduce the number of AFS businesses in that state, skewing the county numbers. But AFS activity is relatively unrestricted in all district states. Moreover, some counties with high AFS market shares are located in states (such as Wisconsin) where the industry is somewhat more regulated than in other district states.
It's conceivable that AFS providers are just following in the footsteps of banks and credit unions, setting up shop in the same areas. To test this hypothesis, the fedgazette performed the same statistical analysis, comparing county demographic statistics with a measure of the relative size of the mainstream financial services sector in a given county.
It turns out that the pattern for banks, credit unions and other traditional financial services providers is roughly the reverse of that for the AFS industry. For instance, banks are highly concentrated in Dakota County, which comprises much of the Twin Cities' southern suburbs. The county ranks high in median income and has a low poverty rate; the opposite is true for counties with high AFS scores.
Thus the available evidence suggests that demographic factors are indeed important in explaining why AFS providers locate where they do—with an important caveat. Not every county in the district fits the pattern you'd expect to find based on AFS user surveys.
Take Burleigh County, N.D., for example. Statistically, the county doesn't look like fertile ground for AFS providers: Its poverty rate runs well below the national average, its median household income is higher, and relatively few single parents and noncitizens live there. Yet the county's AFS market share ranks it in the top 10 percent of district counties. At the other extreme, some counties near the bottom of the AFS rankings might be expected to score higher based on their demographic makeup.
Nothing in the fedgazette analysis suggests that AFS operators pore over Census statistics when they're deciding where to open new outlets or expand existing ones. Their location choices are probably not that deliberate. But well-functioning markets adjust the supply of a good or service to demand. If the populations of counties with higher proportions of "fringe banking" differ statistically from those in counties with more traditional banking, it's probably because the two industries serve different markets.
As a payday lender in Bismarck observed, "You can't go to a bank and borrow $50." AFS providers may charge a premium for their services, but they seem to fulfill needs that are not being met by banks.
Additional Charts

Joe Mahon is a Minneapolis Fed regional outreach director. Joe’s primary responsibilities involve tracking several sectors of the Ninth District economy, including agriculture, manufacturing, energy, and mining.