Loading State Oil Production chart...
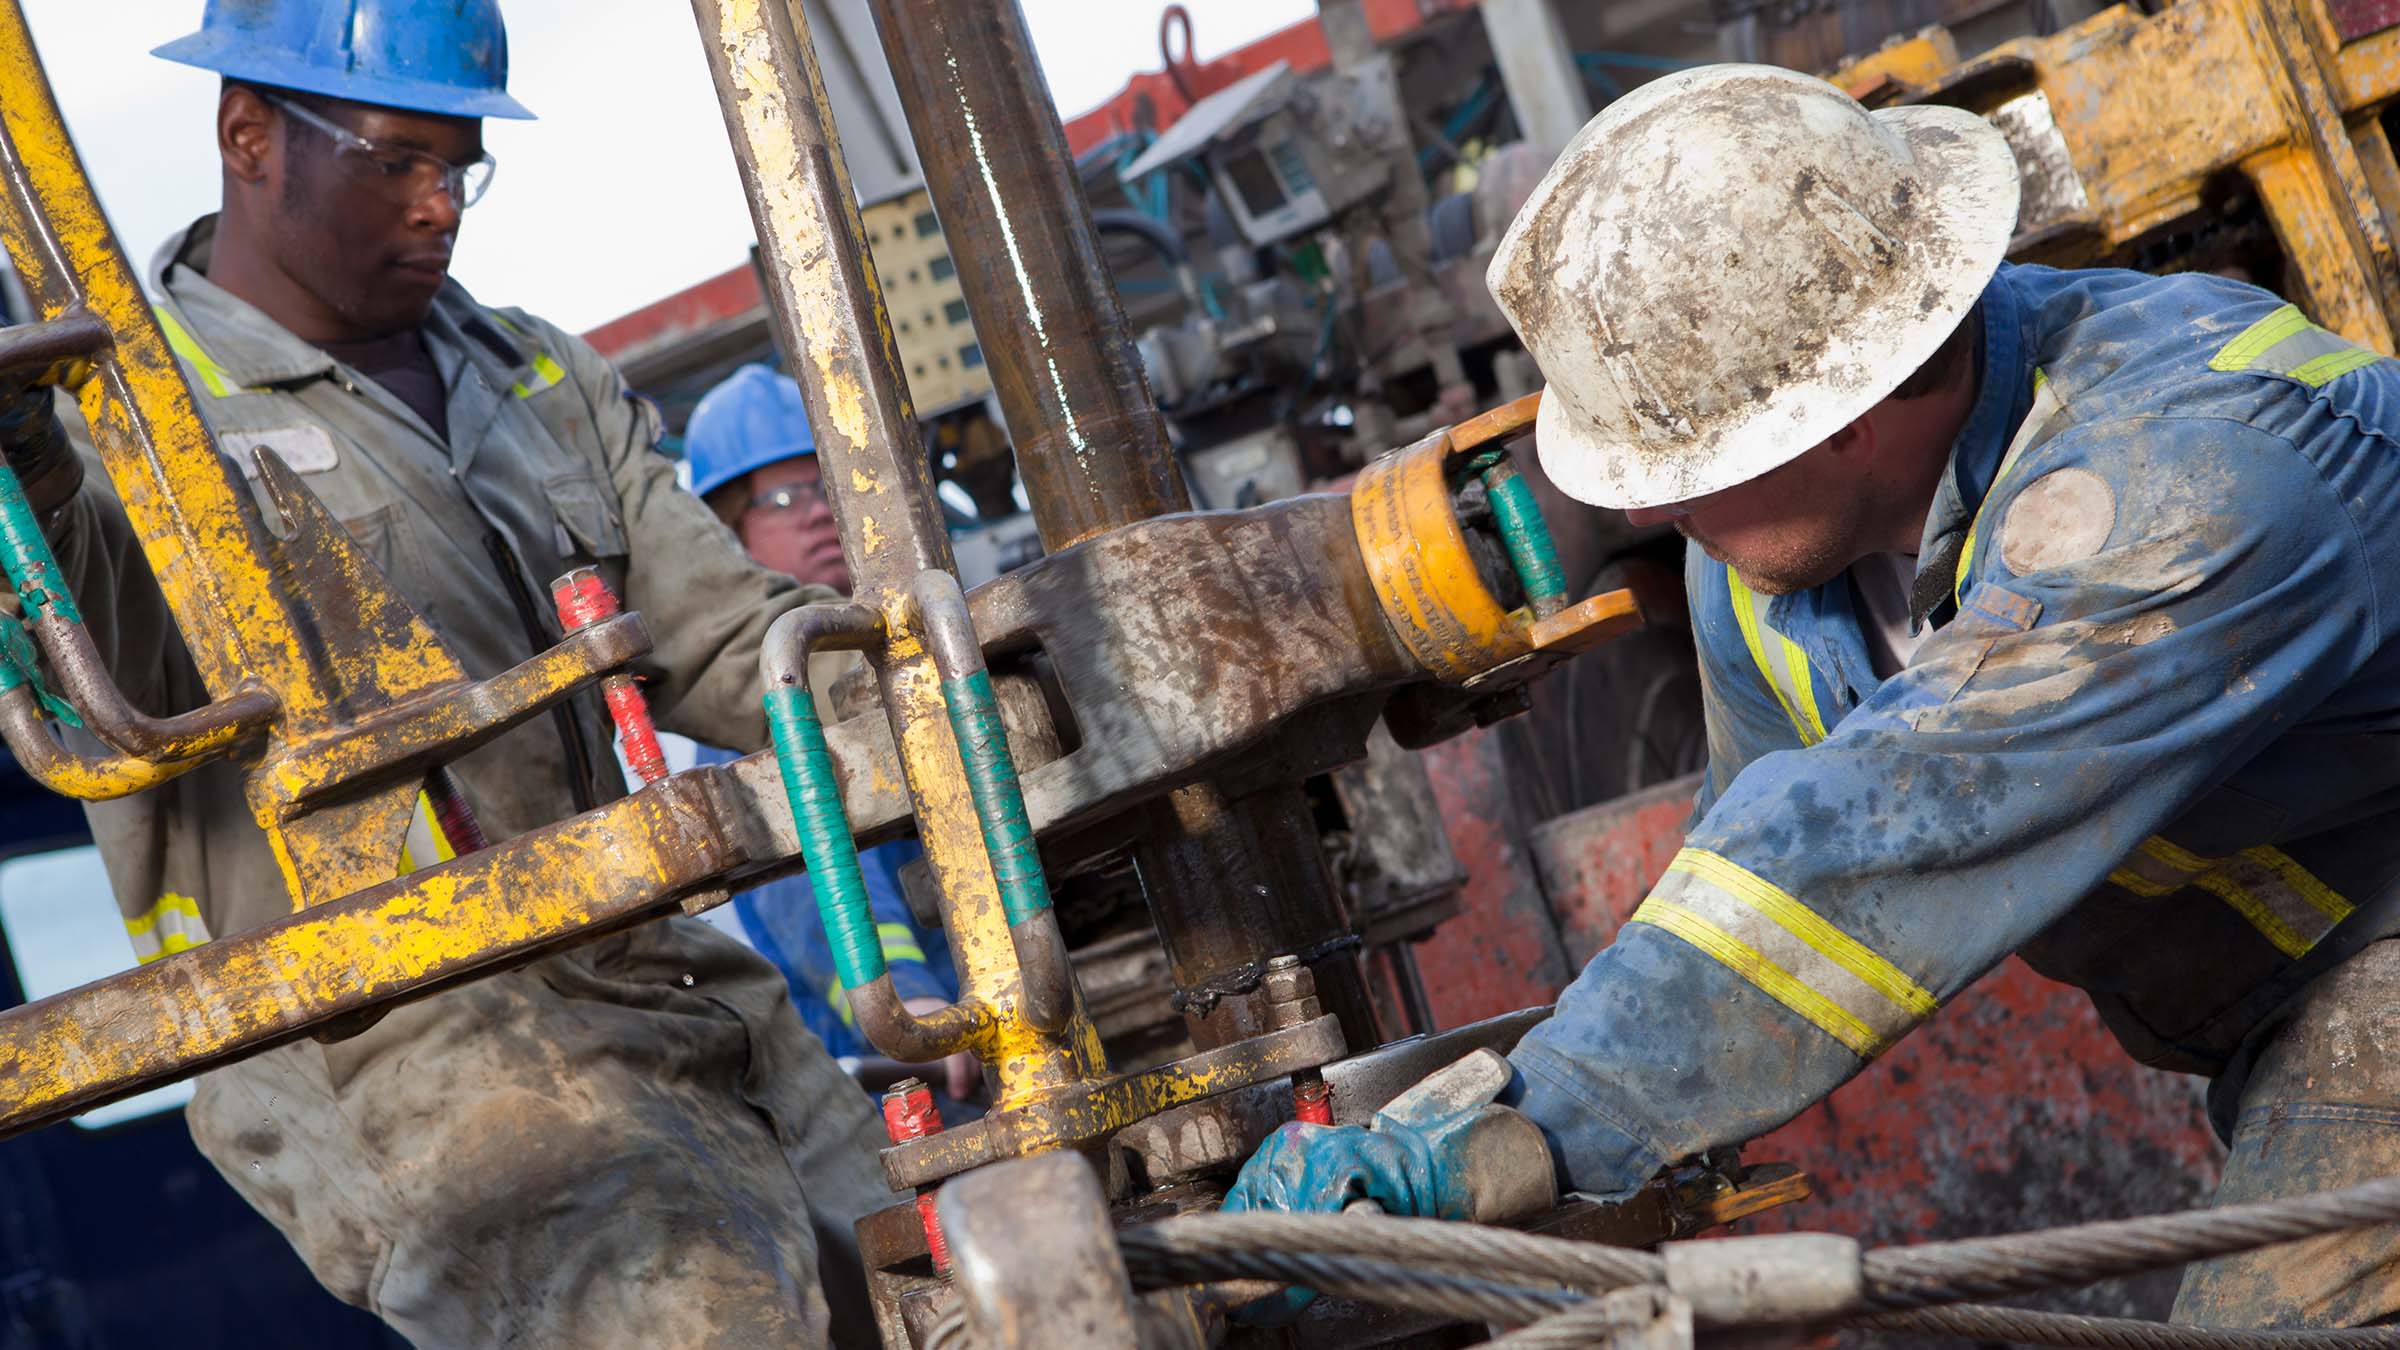
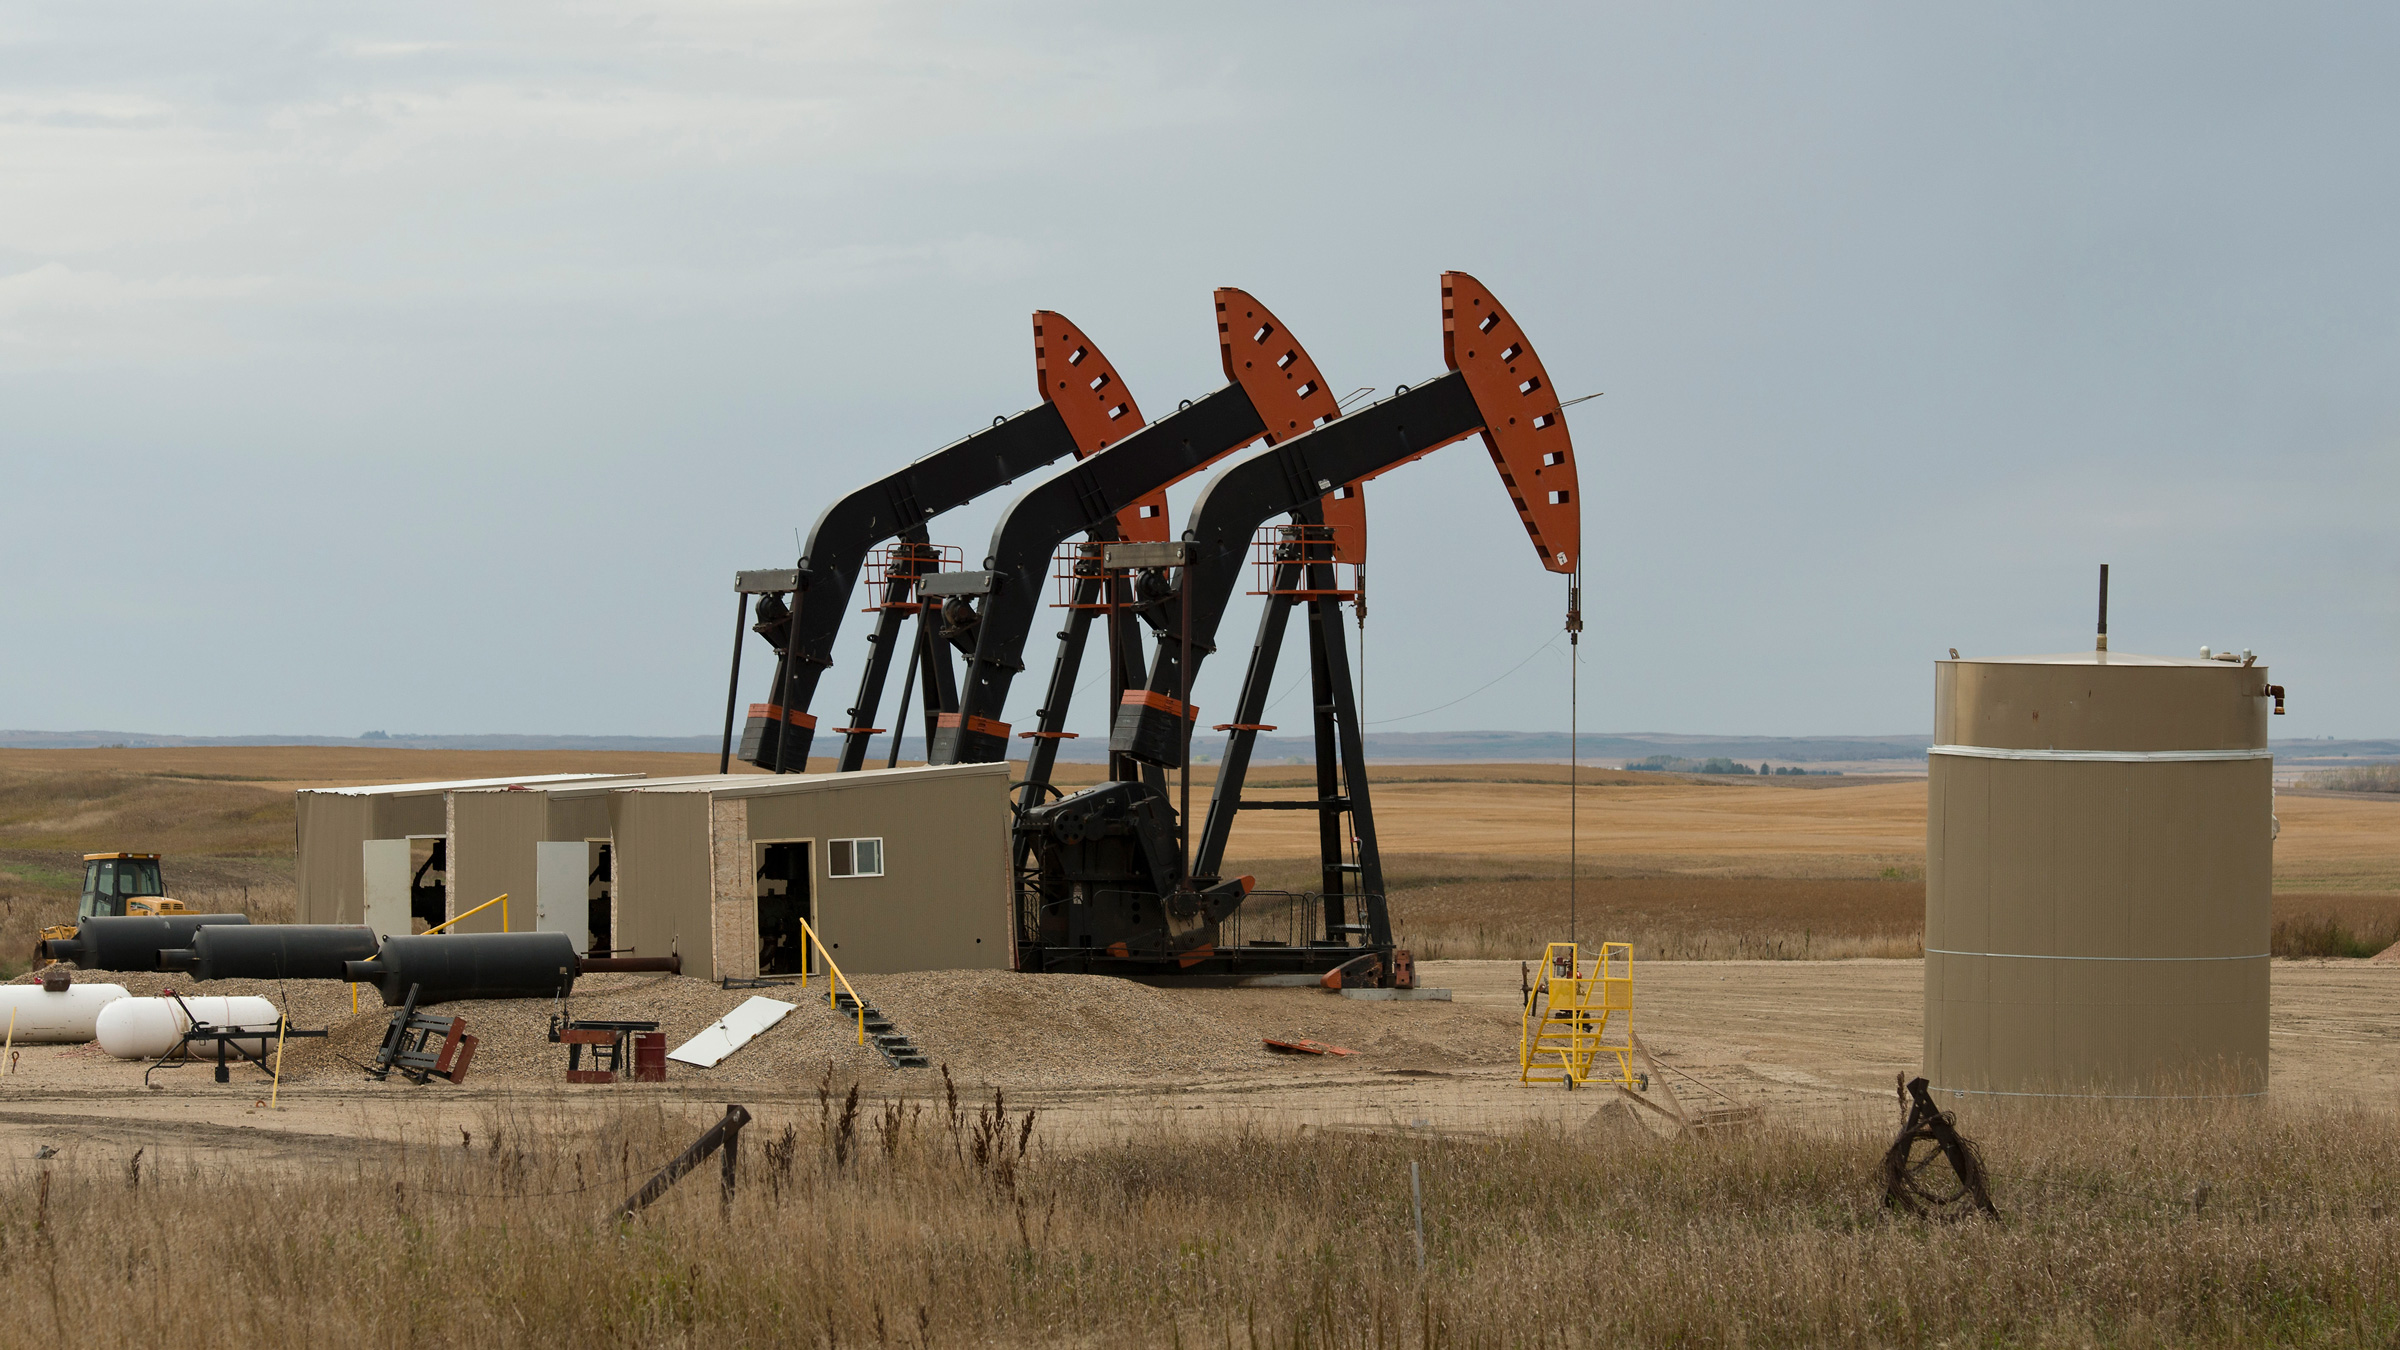
North Dakota is the third largest oil-producing state in the country behind New Mexico and Texas.
Loading Active oil drilling rigs and oil price chart...
Oil Drilling Rigs
| Mar 2026 | Pct. change from a year earlier | |
|---|---|---|
| North Dakota | 26 | -16% |
| Montana | 2 | 100% |
Oil prices
| Mar 2026 | Pct. change from a year earlier | |
|---|---|---|
| Cushing, OK WTI Spot Price | $90.84 | 33% |
Loading Oil Production chart...
The Bakken area represents most of oil production in Montana and North Dakota.
Production (millions of barrels)
| Dec 2025 | Pct. change from a year earlier | |
|---|---|---|
| Bakken Oil Counties | 36 | 5% |
| Rest of Montana | 0 | -25% |
| Rest of North Dakota | 1 | -25% |
Loading Employment chart...
Employment doubled in the Bakken from 2009 to 2015; however, employment levels fell steeply in 2015 and 2016 as oil drilling slowed, before resuming a slow climb until early 2020.
Employment (Thousands)1
| Dec 2025 | Pct. change from a year earlier | |
|---|---|---|
| Bakken Oil Counties | 65.81 | 0.6% |
| Rest of Montana | 548.40 | -0.3% |
| Rest of North Dakota | 364.77 | 1.0% |
Loading Unemployment chart...
The decrease in the Bakken unemployment rate following 2009 was sharper than other areas. After increasing with the decline in drilling from 2015 to 2017, unemployment resumed its downward trajectory prior to the COVID-19 pandemic.
Unemployment Rate1
| Dec 2025 | Pct. point change from a year earlier | |
|---|---|---|
| Bakken Oil Counties | 2.6% | 0.1% |
| Rest of Montana | 3.1% | 0.1% |
| Rest of North Dakota | 2.6% | 0.2% |
1 12-month moving average
Loading Wages chart...
Average Weekly Wages
| Third Quarter 2025 |
Pct. point change from a year earlier | |
|---|---|---|
| Bakken Oil Counties | $1,558 | 4.0% |
| Rest of Montana | $1,201 | 0.4% |
| Rest of North Dakota | $1,229 | -0.2% |
Last Updated April 16, 2026