Authors

Toby Madden
Regional Economist

Signs of growth continue in the district economy. The first months of 2005 provided some good news for natural resource industries, manufacturing and commercial construction. Looking forward, the Minneapolis Fed's forecasting model predicts growth in personal income, with slowing growth in employment for the remainder of 2005 and into 2006 (see charts).
District employment is above year-ago levels in most industries. Employment in natural resource industries advanced amid strong demand for minerals and energy. Commercial construction activity has shown signs of improvement, while the forecasting model provides optimistic prospects for home building. The agricultural sector recorded a strong year in 2004. However, during the first half of 2005, input prices increased while commodity prices decreased slightly, a trend that is expected to continue into 2006.
Employment expands; consumer prices up
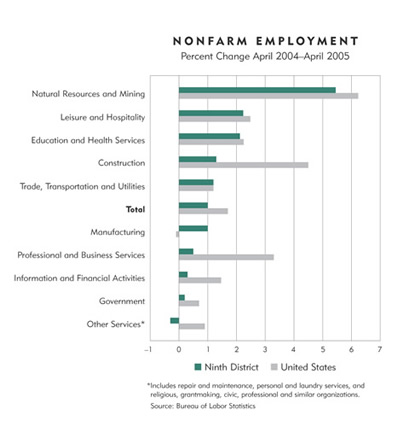
Employment in April 2005 was up 1.0 percent in district states compared with a year ago. Industries with the fastest growth included natural resources and mining (5.4 percent), leisure and hospitality (2.2 percent) and education and health services (2.1 percent). In contrast, industries with the slowest growth included information and financial activities (0.3 percent) and government (0.2 percent). "Other services" was the only category with a decrease in employment (-0.3 percent).
Strong employment gains in natural resources and mining can be traced back to increased demand for minerals and energy. Not only have domestic needs pushed up demand for raw materials and energy, but strong global demand, particularly in China, has contributed to increased production. Nationally, mining production was up for several minerals in 2004; iron ore production was estimated at a 4-year high. In addition, the number of oil rigs operating in the western part of the district was up 25 percent in mid-May compared with a year earlier.
Strong demand for building and manufacturing materials has propped up prices compared with last year. According to the producer price index, materials and components for manufacturing and construction increased about 6.5 percent in April from a year ago. However, these price increases generally haven't been passed on to consumers, as prices for consumer goods were relatively stable. In April, the consumer price index, excluding the relatively volatile food and energy sectors, was 2.2 percent higher than a year ago.
District manufacturing employment posted gains in April relative to a year ago, while manufacturing employment was down slightly nationally. According to a monthly survey of supply managers and business leaders by Creighton University, manufacturing activity in April expanded in North Dakota and South Dakota, with a slight decrease in Minnesota. The survey report projects gains in manufacturing employment during 2005 for all three states.
The Minneapolis Fed's forecasting model predicts overall employment to grow in the district during the rest of 2005, but at rates lower than historical averages (see charts). In 2006, the rate of employment growth is expected to slow in most areas of the district. Meanwhile, unemployment rates are expected to increase slightly in district states. Because the forecasting model simultaneously predicts employment gains and unemployment rate increases, more people likely will enter the labor force and actively look for jobs relative to growth in new job openings.
Will the housing boom continue?
Growth in residential construction was a notable ingredient to the economic recovery following the recession in 2001. Even during the economic downturn, when manufacturing and business investment languished, home building and residential real estate showed robust activity.
Strong gains in household wealth during the 1990s and relatively low mortgage rates contributed to increased demand for new home construction and existing home sales during the past four years. In 2000, 30-year fixed mortgage rates peaked at about 8.5 percent; rates dropped to as low as 5.2 percent in 2003. During the past four years, housing units authorized on average increased 6 percent annually in district states, while existing home sales were up 8 percent annually.
Will home building and sales continue their upward trend? During the first four months of 2005, district housing units authorized were down almost 4 percent compared with the same period a year ago. Meanwhile, the seasonally adjusted annual rate for existing home sales in district states was up 3 percent during the first quarter of 2005 compared with first quarter 2004, but was down 18 percent from its peak in second quarter 2004. The decrease in authorizations and recent slowdown in existing home sales occurred despite little change in 30-year mortgage interest rates, which averaged 5.78 percent during the first four months of 2005.
Nevertheless, recent national statistics for new home sales were strong, and results of the Minneapolis Fed's forecasting model indicate that Minnesota is the only district state expected to post decreases in housing units authorized during the fourth quarter of 2005 compared with fourth quarter 2004. Authorizations are expected to grow in all district states during 2006.
While residential construction has posted strong gains since 2000, commercial construction has been in a slump. From 2000 to 2004, the value of contracts awarded for large building projects, such as buildings, roads and sewer systems, decreased 2 percent annually on average in Minnesota and the Dakotas, according to the Construction Bulletin.
However, during the first three months of 2005, contracts awarded for large construction projects were up 16 percent compared with a year earlier, primarily due to increases in contracts for private buildings and roads and bridges. In addition, construction for industrial space has shown signs of picking up in the Minneapolis-St. Paul area during 2005, according to a report from a commercial real estate firm.
Ag outlook shaky
In general, 2004 was a great year for agricultural producer income, with high prices and large harvests. The first half of 2005 saw profits decrease as input costs increased and prices for most district commodities decreased slightly from strong levels. A cool, wet spring delayed crop planting, emergence and development. However, the precipitation relieved drought conditions somewhat in the western portion of the district. The price outlook for 2005 and 2006 is discouraging for crop producers, as prices are expected to drop below 2002 levels. Livestock and dairy producers are expecting prices to fall, but to remain at historically strong levels.
"2005 may be a tough year," commented a South Dakota agricultural lender to the Minneapolis Fed's first quarter (April) agricultural conditions survey. The respondents expect weakening profits in the second quarter of 2005.
The outlook for the next year and a half in agriculture is not good. Farm profits are expected to decrease due to lower prices, decreased production and higher input costs. As shown in the table, projected 2006 prices for corn, soybeans, wheat, milk, cattle and hogs are lower than in 2004. Meanwhile, lagging crop development across the district may hurt yields. For example, as of May 15, only 10 percent and 28 percent of the Minnesota corn crop and soybean crop, respectively, have emerged, compared with 50 percent and 68 percent a year ago. On the bright side, timely rain and good growing conditions aided the winter wheat crop, and district producers are expecting a harvest of 147 million bushels, up 20 percent from 2004.
Besides overall lower revenue, costs are expected to increase. April agricultural machinery prices were up 6 percent from a year ago; fertilizer, 8 percent; and diesel fuel, 46 percent. Agricultural producers may try to increase productivity to mitigate this profit squeeze; survey respondents expect to increase capital investment in the second quarter.
| AVERAGE FARM PRICES | ||||
|---|---|---|---|---|
| 2002/ 2003 |
2003/ 2004 |
Estimated 2004/2005 | Projected 2005/2006 | |
| (Current $ per bushel) | ||||
| Corn | 2.32 |
2.42 |
2.00-2.10 |
1.55-1.95 |
| Soybean | 5.53 |
7.34 |
5.70 |
4.95-5.95 |
| Wheat | 3.56 |
3.40 |
3.39 |
2.65-3.15 |
| 2003 | 2004 | Estimated 2005 | Projected 2006 |
|
|---|---|---|---|---|
| (Current $ per cwt) | ||||
| All Milk | 12.52 |
16.05 |
14.80-15.20 |
13.05-14.05 |
| Choice Steers | 84.69 |
84.75 |
85.00-88.00 |
76.00-82.00 |
| Barrows & Gilts | 39.45 |
52.51 |
48.00-50.00 |
44.00-48.00 |
Source: U.S. Department of Agriculture, estimates as of June 2005. |
||||