Author


Article Highlights
- Agricultural incomes continued to fall in fourth quarter across the district
- Loan demand increased, repayment rates fell, and interest rates dropped moderately
- Land values were mixed; cash rents dropped
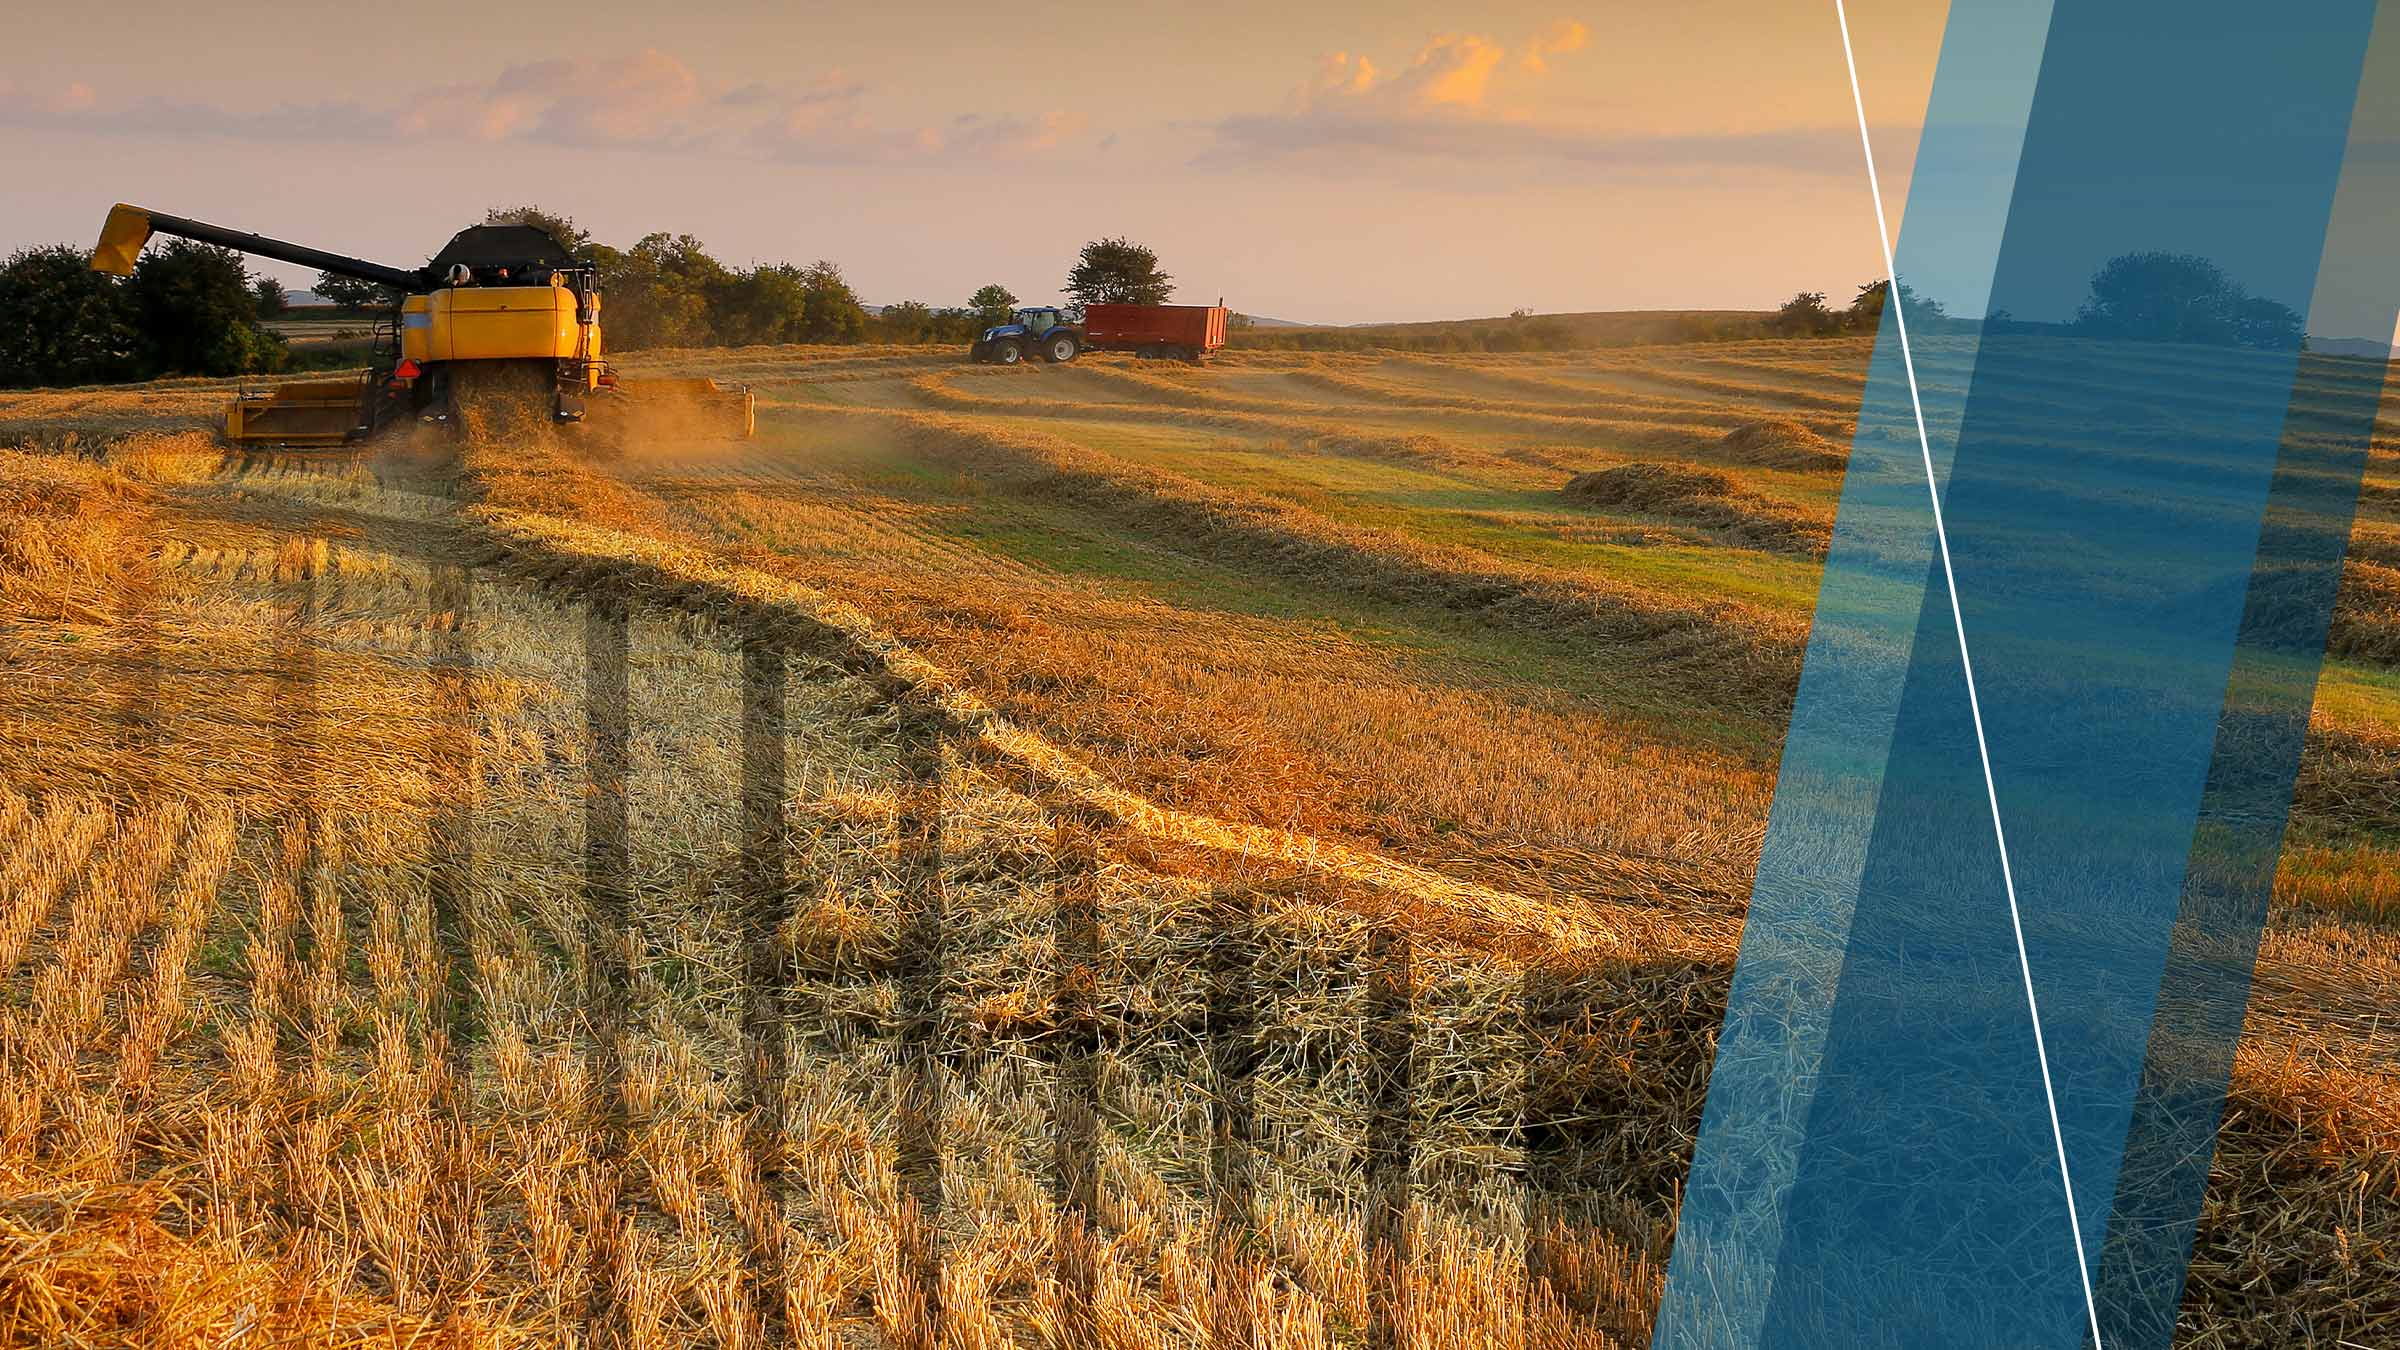
The two biggest uncontrollable factors for farmers—weather and markets—both turned more negative in much of the region at the end of last year. “We have been in a drought and grain prices have been very low,” wrote a Minnesota banker, “making for a very tough year for many farmers in our area.”
Farm incomes decreased broadly across the Ninth District, according to lenders responding to the fourth-quarter Ag Credit Survey by the Minneapolis Fed. Lenders also reported that spending on capital equipment fell, though farm household purchases increased on balance. With cashflows weakening, demand for loans increased, while the rate of loan repayment dropped, and loan renewal and extension activity increased. Interest rates for agricultural loans fell moderately but remained high. Land values increased slightly overall from a year earlier, while cash rents fell. The outlook for the first quarter of 2025 was pessimistic, with survey respondents expecting a further decrease in incomes.
Farm income and spending
Bankers across the district almost unanimously agreed that farm incomes fell. District-wide, 89 percent of agricultural lenders surveyed said incomes decreased in the third quarter from a year earlier, while only 4 percent reported increased incomes. Farm incomes have fallen steeply for eight straight quarters, flipping from very strong to very weak (see chart). Capital expenditures also dropped, with 69 percent of respondents reporting decreased investment in equipment and buildings from a year ago, compared with 11 percent reporting increased spending. In contrast, spending by farm households increased slightly on balance, though half of respondents reported no change.
Loan demand and credit conditions
“Liquidity will be down and demand for loans up,” said one banker. Most others agreed, as nearly half of respondents indicated that loan demand increased from last year, compared with 11 percent who said it was lower. While a slight majority of banks said there was no change to loan renewals or extensions, the remainder said that renewal activity increased.
Credit conditions weakened overall. About half of lenders (48 percent) indicated that the rate of repayment on agricultural loans decreased relative to a year ago, and the same proportion reported that repayment rates held steady. While most lenders reported no change to collateral requirements on loans, 20 percent said collateral requirements increased. A South Dakota banker commented that they “anticipate quite a few downgrades in credits this renewal season.” However, no respondents reported having refused a loan due to a shortage of funds.
One bit of good news for the sector: Farm borrowers got more relief from falling interest rates. Fixed and variable rates on operating, machinery, and real estate loans all decreased for the second quarter in a row.
Land values and cash rents
Farmland values in the district have been rising over the last four years, and while that continued in the fourth quarter, the pace of increase was slight overall and mixed across states. Ninth District nonirrigated cropland values increased by 0.5 percent from the fourth quarter of 2023. Irrigated cropland values rose by more than 5 percent from a year earlier, while ranch- and pastureland values increased a little less than 5 percent.
Changes in land values and rents were mixed across the region. Nonirrigated cropland prices increased slightly in Minnesota but fell by more than 3 percent each in North Dakota and Sount Dakota. Meanwhile in Wisconsin (where only a small number of bankers receive the survey) land values soared. “Investors are driving land values, making it harder for farmers to buy additional land,” commented a Wisconsin lender.
The district average cash rent for nonirrigated land decreased by almost 2 percent from a year ago, while irrigated land rents fell nearly 4 percent. In contrast, cash rents for ranchland increased nearly 5 percent.
Outlook
The outlook for agriculture over the opening quarter of 2025 was generally pessimistic, as 80 percent said they expect that farm incomes will decrease in the first quarter, compared with 7 percent who expect higher incomes. Survey respondents also noted the outlook for both farm capital investment and household spending is contractionary, and household spending is expected to flatten. Even with decreased spending expectations, 70 percent of lenders said they expect loan demand to increase. More than half of respondents said they expect the rate of repayment to decrease further in the first three months of the year, but most of them (81 percent) don’t anticipate referring any loans to credit agencies.
| MN | MT | ND | SD | WI | Ninth District | |
|---|---|---|---|---|---|---|
| Percent of respondents who reported decreased levels for the past three months compared with the same period last year: | ||||||
| Rate of loan repayments | 75 | 57 | 18 | 17 | 75 | 48 |
| Net farm income | 100 | 71 | 73 | 92 | 100 | 89 |
| Farm household spending | 30 | 71 | – | 25 | 50 | 22 |
| Farm capital spending | 75 | 43 | 55 | 83 | 75 | 69 |
| Loan demand | 10 | 29 | 18 | – | – | 11 |
| Percent of respondents who reported increased levels for the past three months compared with the same period last year: | ||||||
| Loan renewals or extensions | 50 | 43 | 45 | 25 | 75 | 44 |
| Referrals to other lenders | 20 | 29 | – | 8 | – | 9 |
| Amount of collateral required | 10 | 14 | 27 | 25 | – | 20 |
| Loan demand | 55 | 43 | 55 | 25 | 50 | 46 |
| MN | MT | ND | SD | WI | Ninth District | |
|---|---|---|---|---|---|---|
| Percent of respondents who expect decreased levels for the next three months: | ||||||
| Rate of loan repayments | 70 | 29 | 45 | 50 | 100 | 57 |
| Net farm income | 85 | 86 | 82 | 75 | 50 | 80 |
| Farm household spending | 45 | 29 | 36 | 58 | 50 | 44 |
| Farm capital spending | 80 | 29 | 73 | 67 | 50 | 67 |
| Loan demand | 10 | – | – | 8 | – | 6 |
| Percent of respondents who expect increased levels for the next three months: | ||||||
| Loan renewals or extensions | 50 | 29 | 55 | 18 | 75 | 43 |
| Referrals to other lenders | 25 | – | – | 17 | – | 17 |
| Amount of collateral required | 15 | – | 27 | 17 | 25 | 15 |
| Loan demand | 80 | 57 | 73 | 50 | 100 | 70 |
| Operating | Machinery | Real estate | |||||
|---|---|---|---|---|---|---|---|
| Fixed | Var. | Fixed | Var. | Fixed | Var. | ||
| Q1-23 | April | 8.1 | 8.0 | 7.6 | 7.6 | 7.3 | 7.4 |
| Q2-23 | July | 8.5 | 8.5 | 7.9 | 8.0 | 7.5 | 7.5 |
| Q3-23 | October | 8.8 | 8.7 | 8.3 | 8.2 | 7.9 | 7.9 |
| Q4-23 | January | 8.8 | 8.7 | 8.3 | 8.3 | 8.0 | 8.0 |
| Q1-24 | April | 8.6 | 8.6 | 8.2 | 8.4 | 7.9 | 8.0 |
| Q2-24 | July | 8.8 | 8.7 | 8.4 | 8.5 | 8.0 | 8.1 |
| Q3-24 | October | 8.7 | 8.7 | 8.3 | 8.4 | 7.8 | 8.0 |
| Q4-24 | January | 8.2 | 8.1 | 7.9 | 8.0 | 7.6 | 7.6 |
Joe Mahon is a Minneapolis Fed regional outreach director. Joe’s primary responsibilities involve tracking several sectors of the Ninth District economy, including agriculture, manufacturing, energy, and mining.