Author

David H. Montgomery
Data Journalist (former)
Article Highlights
Around 5 percent of households use no gasoline at all, while 2 percent use more than 90 gallons per week
- The top 20 percent of households use 46 percent of all the gasoline in the Upper Midwest
- Heavy gas users are more likely to have high incomes and have young children at home, while light gas users are more likely to live in cities and drive fuel-efficient vehicles.
Eye-popping gasoline prices in the U.S. are squeezing drivers’ wallets. But the pain at the pump is spread unevenly in the Upper Midwest.
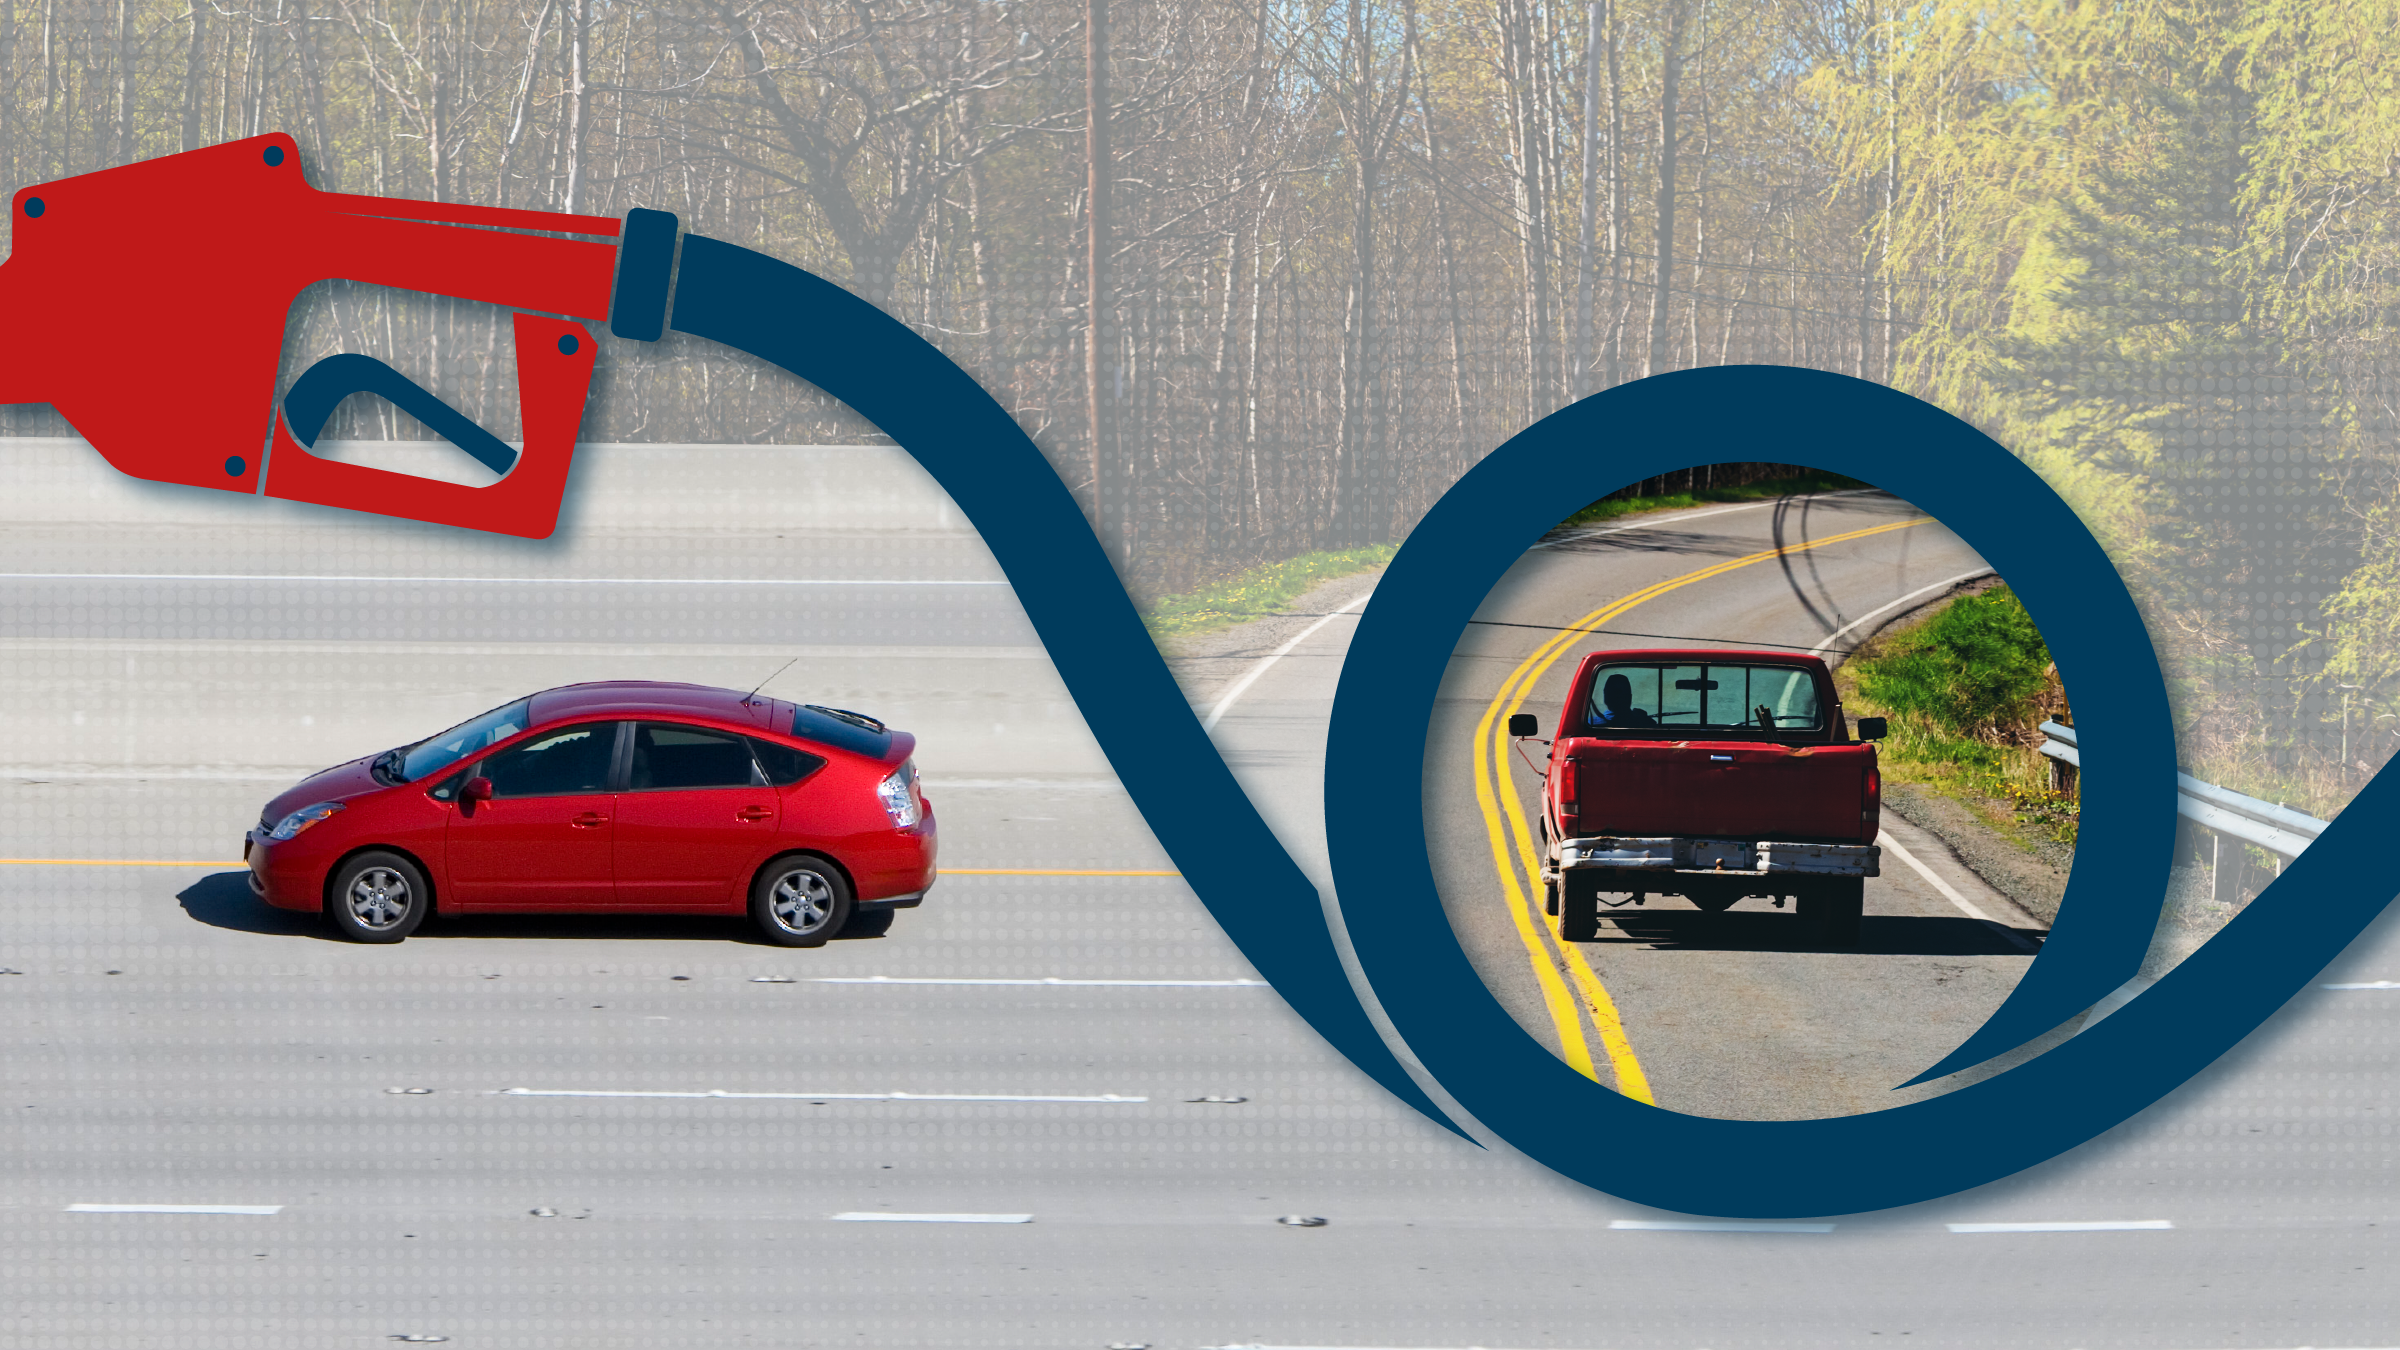
On one extreme, you have people like Victor Dorso, a short-haul owner-operator truck driver based out of Minneapolis. Dorso’s 2003 Volvo truck averages around 5 mpg, and he drives it more than 1,000 miles in a typical week. Every increase in the price of fuel pinches Dorso’s pocketbook.
Then there are people like A.C. Sullivan, also from Minneapolis. Sullivan was averaging less than 100 miles of travel per week in her Kia hatchback, which gets about 30 mpg. Rising gas prices have been just a mild annoyance—and less annoying since Sullivan cut back her driving even more in favor of a daily bus commute.
Dorso and Sullivan are facing the same prices at the pump—$4.70 a gallon on average for regular gasoline in Minnesota as of July 4. That’s an increase of about $1.75, or 60 percent, over the $2.94 per gallon Minnesotans paid at this time last year (Figure 1).
But the impact on their daily lives could hardly be more different—a few extra bucks per week versus hundreds of dollars. With this degree of variation, how can we get a handle on exactly how much this gas price surge is affecting people? There’s not any comprehensive current data on Americans’ gasoline usage. But a major government survey from a few years before the pandemic can give us some clues as to how today’s travelers are impacted.
The 2017 National Household Travel Survey asked hundreds of thousands of Americans for details of their transportation habits, including logging the distance and method of every trip taken on a given day. The survey looks at how different segments of the population get around—or at least how they got around in 2017.
The COVID-19 pandemic spurred significant changes to some people’s commuting patterns, while others shifted from gasoline-powered vehicles to electric cars. Exactly how this 2017 data would be different today is unclear, though the Federal Highway Administration began collecting data for a 2022 update earlier this year.
That 2017 data, for the time being, shows just how big the variations in gasoline use can be in the Upper Midwest.1
From gas-free to gas-guzzling
According to the survey, around 5 percent of households in Minnesota, Wisconsin, North Dakota, South Dakota, and Montana report using no gasoline. Instead, they bike, walk, take public transit, or drive electric vehicles. They may be indirectly affected by rising gas prices but don’t experience gas pump sticker shock.
“It’s very intentional for me and for my family to cut down on our car use as much as possible,” said Sullivan.
At the other extreme, a small number of households use massive amounts of gasoline, often through extensive driving or inefficient vehicles. About 10 percent of households in the Upper Midwest use more than 45 gallons of gasoline per week, while the heaviest drivers use even more.
“You’re scrimping and saving,” said Dorso, the short-haul trucker, adding, “Then you’re no longer scrimping and saving. You’re pulling money out of funds you set aside for these rainy days.”
He eventually gets reimbursed by clients for the cost of gasoline, but Dorso has to foot the bill until those reimbursements get paid. That assumes his creditor doesn’t go bankrupt, which Dorso said is an increasing concern for owner-operator truckers like him.
Everyone else is in between those two extremes. Just under one-third of households use 10 gallons per week or less, while the median home averages around 17 gallons per week (Figure 2).
Put another way: the bottom 20 percent of all Upper Midwest households—about 1.1 million homes—use only about 2.5 percent of all the region’s consumer gasoline. The top 20 percent of households account for about 46 percent of all gas usage.
Unsurprisingly, this disparity in gas usage translates to big differences in money when gas prices soar as they have lately.
It’s simple to plug that roughly $1.75 per gallon cost increase into the 2017 gas usage data to see how deeply these prices would bite into different pocketbooks.
If driving habits remain the same as in 2017, the median household in the Upper Midwest will pay about $29 more per week for gasoline.
Debbie Gabse is one of those in-between households. Living in Boulder, Montana, she drives a compact Honda SUV that gets up to 30 mpg on the highway and fewer in the city. Gabse said she’d love to drive less as gas prices go up, but that’s difficult living in small-town Montana, where essential errands are 30 miles away. She averages about 300 miles per week or around 10 to 15 gallons. That’s slightly below the household average for the Upper Midwest, and so far, she’s enduring the higher prices.
“I close my eyes and turn on the pump,” Gabse said.
About 18 percent of homes are being hit for $10 extra per week or less, while the heaviest 10 percent of drivers are paying $78 or more each week (Figure 3).
Adjusting for income
These estimated gas price increases don’t tell the whole story. An extra $10 per week in fuel prices could be trivial for one household and serious for another. An additional $80 per week could be an annoyance or apocalyptic for different family budgets.
The 2017 survey can give us a very rough estimate of how deeply these price hikes might hit pocketbooks. In addition to driving habits, it provided ranges for household income. We compared the extra spending each household’s gas usage would cause with the midpoint of their income—for example, $87,499.50 for a range of $75,000 to $99,999.
The result shouldn’t be interpreted too strongly, but does give a sense of the range of outcomes. About 35 percent of households are facing relatively minor impacts, paying some extra but less than 2 percent of their weekly income.
Another 35 percent or so are seeing bigger impacts, anywhere from 2 to 5 percent of income.
At the extremes, just under 5 percent of homes use no gasoline and see no impact, while up to a quarter might be paying 5 percent, 10 percent, or even more of their income due to the rise in gas prices (Figure 4).
Income and driving habits interact in disparate ways. On average, lower-income households are more vulnerable to gas price spikes, with the extra $1.75 per gallon eating up 5 percent, 10 percent, or even more of their limited income. Richer households tend to drive more than poorer families but spend less on gasoline as a share of their income.
All this makes one big assumption: that households would continue driving the same amount in response to the higher gas prices. In practice, many homes might take fewer trips, carpool, switch to a more fuel-efficient vehicle, or take other options to protect themselves from the price spike.
Research shows people do adapt to higher gas prices—but that big changes are often long-term responses, said Jason Cao, a professor at the University of Minnesota’s Humphrey School of Public Affairs.
“If the price just stays there for a very short time, then people tend to have this inertia,” Cao, who researches transportation, said. It’s only when high gas prices look like they’re here to stay that people make more meaningful choices like buying more efficient cars or moving to homes with shorter or non-driving commutes.
Cao said most of these adaptations are easier for upper-income people to make than the low-income households. For example, when the COVID-19 pandemic first hit in 2020, Cao and Ph.D. student Tao Tao observed bigger traffic declines in areas with affluent households. Those communities were dominated by people who could easily work remotely. Lower-income areas saw much smaller traffic drops because fewer residents there had the flexibility to change how and how much they traveled for work.
Gabse, the Montana retiree, said that in an ideal world, she’d have bought a more efficient car than her SUV. But her fixed income and particular needs limited that choice.
“It would have been nice if I could have afforded a hybrid, but it just wasn’t in my price range,” she said. “I do realize I bought an SUV rather than a smaller sedan, but I live in Montana, and I have to be able to go over passes, and I have to be able to go in the snow.”
Characteristics of heavy and light drivers
Households in Minnesota, Montana, Wisconsin, North Dakota, and South Dakota collectively used nearly 7 billion gallons of gasoline in 2017, or an average of around 1,200 gallons per household.
Those are some of the highest rates in the country, which makes sense because all the states involved are large with spread-out populations.
In general, the heaviest gasoline users in the Upper Midwest tend to drive a lot, and in less efficient vehicles. More than 99 percent of this top tier of gasoline users say they use their car at least once per week, while only 71 percent of the bottom tier of gasoline users drive weekly. Meanwhile, nearly two-thirds of these heavy gas users in the 2017 survey said they average less than 20 mpg, which is three times more common than among the lowest tier.
Heavy gas users are also more likely to live in rural areas, be White, have household incomes over $100,000 per year, and have young children at home.
In contrast, the households in the Upper Midwest who use the least gasoline are more likely to live in cities, drive cars that get at least 30 mpg, and regularly get around by walking, biking, or taking mass transit.
This 20 percent of households who use the least gasoline still use cars as a major method of mobility. More than two-thirds of these households drive weekly or more, higher than any other method of transport (Figure 5).
The 2017 survey found fairly low levels of hybrid vehicle ownership and meager electric car ownership rates. These figures are likely higher today.
Kia owner Sullivan has experience as both a heavy gasoline user and a light one. Last year she lived in North Carolina and commuted up to 2 ½ hours per day. Today, she lives close to her work and takes the bus.
“The biggest help to me right now is not having to worry about it in the slightest,” said Sullivan, who drives about once per week. “I don’t have to worry about gas or whether I filled up my tank.”
Endnote
1 The Federal Highway Administration periodically conducts a National Household Travel Survey, which surveys a representative nationwide sample about how they get around. The most recent finished survey dated from 2017, though another round is currently in progress.
For this analysis, the Minneapolis Fed arranged households by total gasoline usage and used sample weights to divide the population into percentiles. On the recommendation of the Bureau of Transportation Statistics, the Minneapolis Fed excluded the heaviest 1 percent of gasoline users as outliers likely to be unrepresentative or incorrect.