Authors


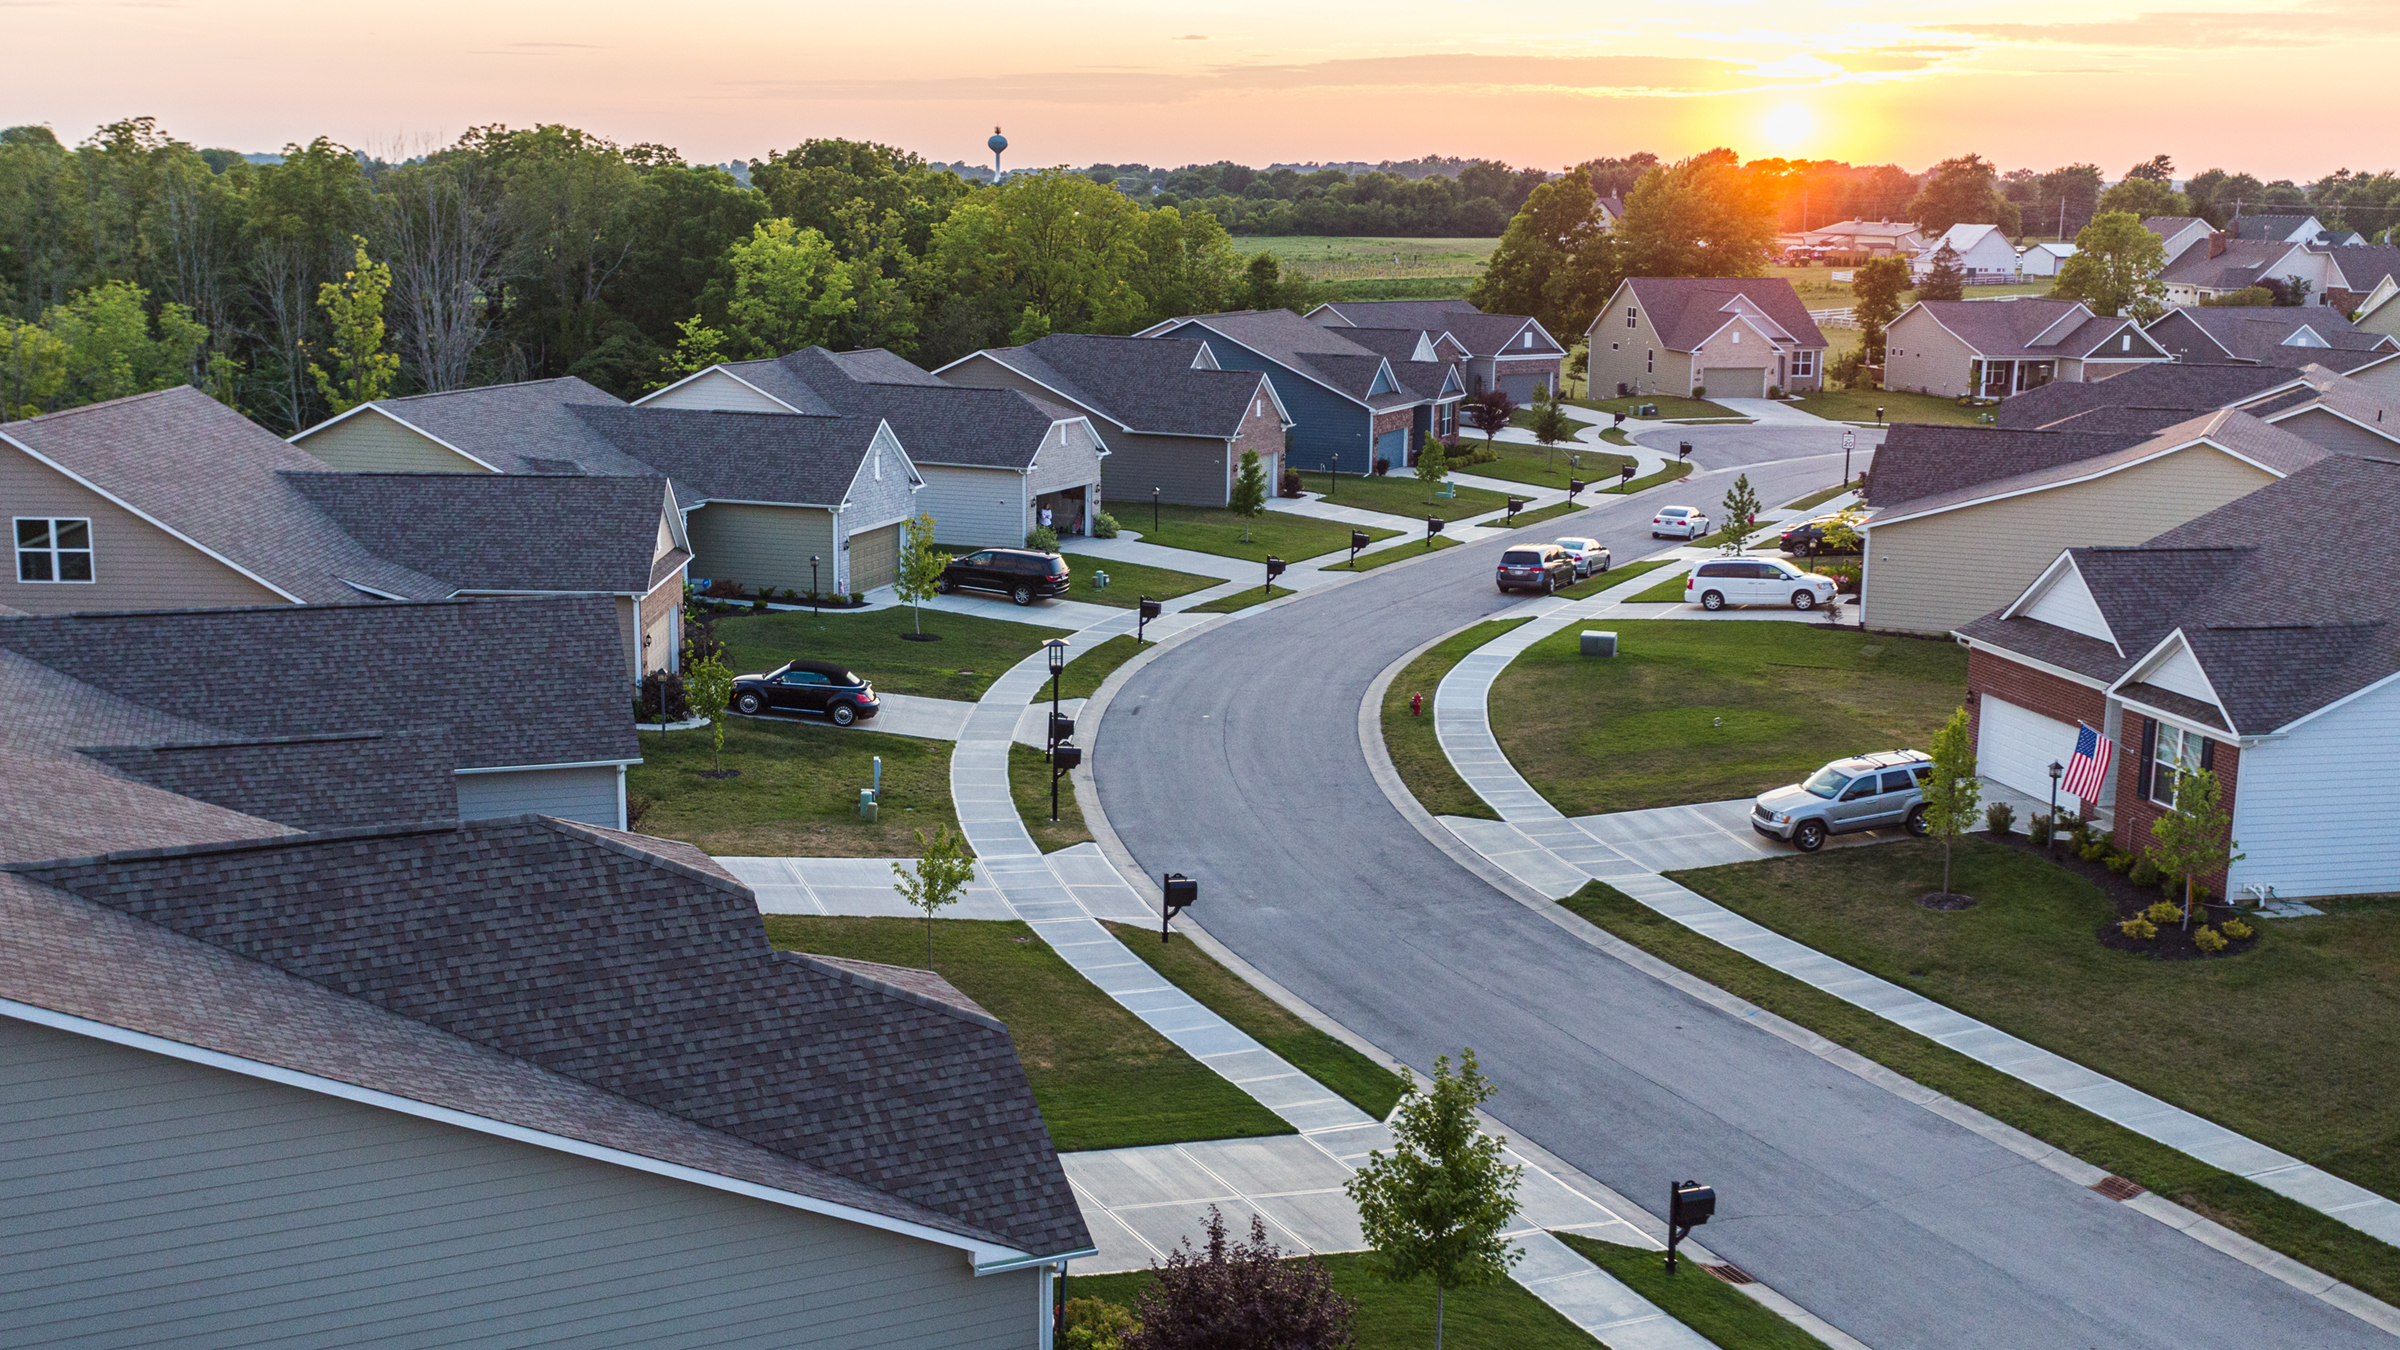
For many households, mortgage payments represent each month’s single largest living expense. If homeowners are dealing with job loss, medical bills, or other financial distress, they occasionally delay their mortgage payments, becoming delinquent on their mortgages even at the risk of losing their homes to foreclosure.
Understanding where at-risk homeowners live enables policymakers and practitioners to more effectively target resources for preventing foreclosure and supporting sustainable homeownership. To illuminate where at-risk homeowners are, we’ve constructed a dashboard that tracks mortgage-delinquency and foreclosure rates in the Ninth Federal Reserve District over time and by ZIP Code, with the data broken down by different mortgage characteristics. Because the data in the dashboard are proprietary, they might not otherwise be accessible to organizations that design or deliver foreclosure interventions.
The pandemic-induced recession caused abrupt and devastating economic harm to many families. The dashboard shows a sharp increase in delinquency rates in spring 2020 with a return to pre-pandemic mortgage performance still incomplete by summer 2021. This pattern reflects the economic damage inflicted by COVID-19 as well as the policy response to the recession. In addition to expanded unemployment benefits and direct stimulus payments, many homeowners facing economic challenges could access mortgage forbearance from their lenders and benefited from a federal foreclosure moratorium through July 2021 (U.S. Government Accountability Office, 2021). As our data consider homeowners who have received forbearance delinquent, the availability of mortgage forbearance may be partially responsible for the higher delinquency rates shown during the pandemic.
About the dashboard
The dashboard shows trends of 30-, 60-, and 90-day delinquency rates and foreclosure rates over time and by ZIP Code for the four states that lie wholly within the Ninth District: Minnesota, Montana, North Dakota, and South Dakota. Users can view trends over time by clicking on the “State” button to display statewide data in a chart format or the “ZIP Code” button to show a ZIP Code-level map.
In the “State” view, the delinquency and foreclosure rates for each state can be disaggregated, or broken down, by credit score, principal and interest payment, year in which the first payment occurred, and metropolitan or nonmetropolitan status. Users can also filter by the types of loans (original mortgages, refinanced mortgages, or both). The bottom chart in the “State” view shows the distribution of mortgages across the selected disaggregation levels. Users can use the date slider to zoom to the time period they want.
Due to sample size, the disaggregation can only be applied to the “State” view’s time-series chart. For the “ZIP Code” view, users can choose the metric and state they’d like to see. The map shows the data from the most recent month available.
About the data, and key terms
The dashboard uses Black Knight McDash data, which capture the servicing portfolios of the largest residential mortgage servicers in the United States, covering over half of all mortgages. As noted above, these data are proprietary; however, the Federal Reserve Bank of Minneapolis is allowed to disseminate the information with a three-month lag.
Credit scores. Credit-scoring agencies (e.g., Equifax) assign a numeric credit score to borrowers as an indicator of borrowers’ likelihood of repaying their debts. Our dashboard groups credit scores into four categories: “Poor” if 579 or below, “Fair” if between 580 and 669, “Good” if between 670 and 739, “Very good” if between 740 and 799, and “Exceptional” if 800 or above.
Delinquency. A mortgage is considered delinquent if regularly scheduled payments have not been made for 30, 60, or 90 days or more. Note that a mortgage may be delinquent in this sense even though a borrower has been approved for mortgage forbearance. Additionally, these categories are not mutually exclusive; for example, a mortgage that is 60 days delinquent would also be 30 days delinquent.
First-payment cohort. The year in which the first payment on an individual mortgage was due determines the first-payment cohort.
Forbearance. A mortgage is considered to be in forbearance if the lender or loan servicer allows a borrower to pause or reduce payments for a specified period of time.
Foreclosure. A mortgage is considered to be in foreclosure if it is currently engaged in a legal process intended to end with the lender’s acquisition of the property.
Metropolitan status. Properties in ZIP Codes that have 50 percent or more of residential addresses in a metropolitan or micropolitan area are considered metropolitan. For more detail about the mapping of ZIP Codes to a metropolitan or micropolitan area, see the U.S. Housing and Urban Development USPS ZIP Code crosswalk files.
Principal and interest payment. Borrowers’ monthly payments cover the principal and interest on their mortgage loans (the dashboard does not include taxes or insurance, which some households escrow monthly and include with their regular payment). Each grouping under this category in the dashboard captures a quintile, or 20 percent, of the distribution of the principal and interest payments among the sample. Mortgages switch categories when the principal and interest payment is not constant through the term of the mortgage. In our sample, over 88 percent of the mortgages have constant principal and interest payments throughout the term of the loan.
Libby Starling is Senior Community Development Advisor in Community Development and Engagement at the Federal Reserve Bank of Minneapolis. She focuses on deepening the Bank’s understanding of housing affordability, concentrating on effective housing policies and practices that make a difference for low- and moderate-income families in the Ninth Federal Reserve District.