Authors


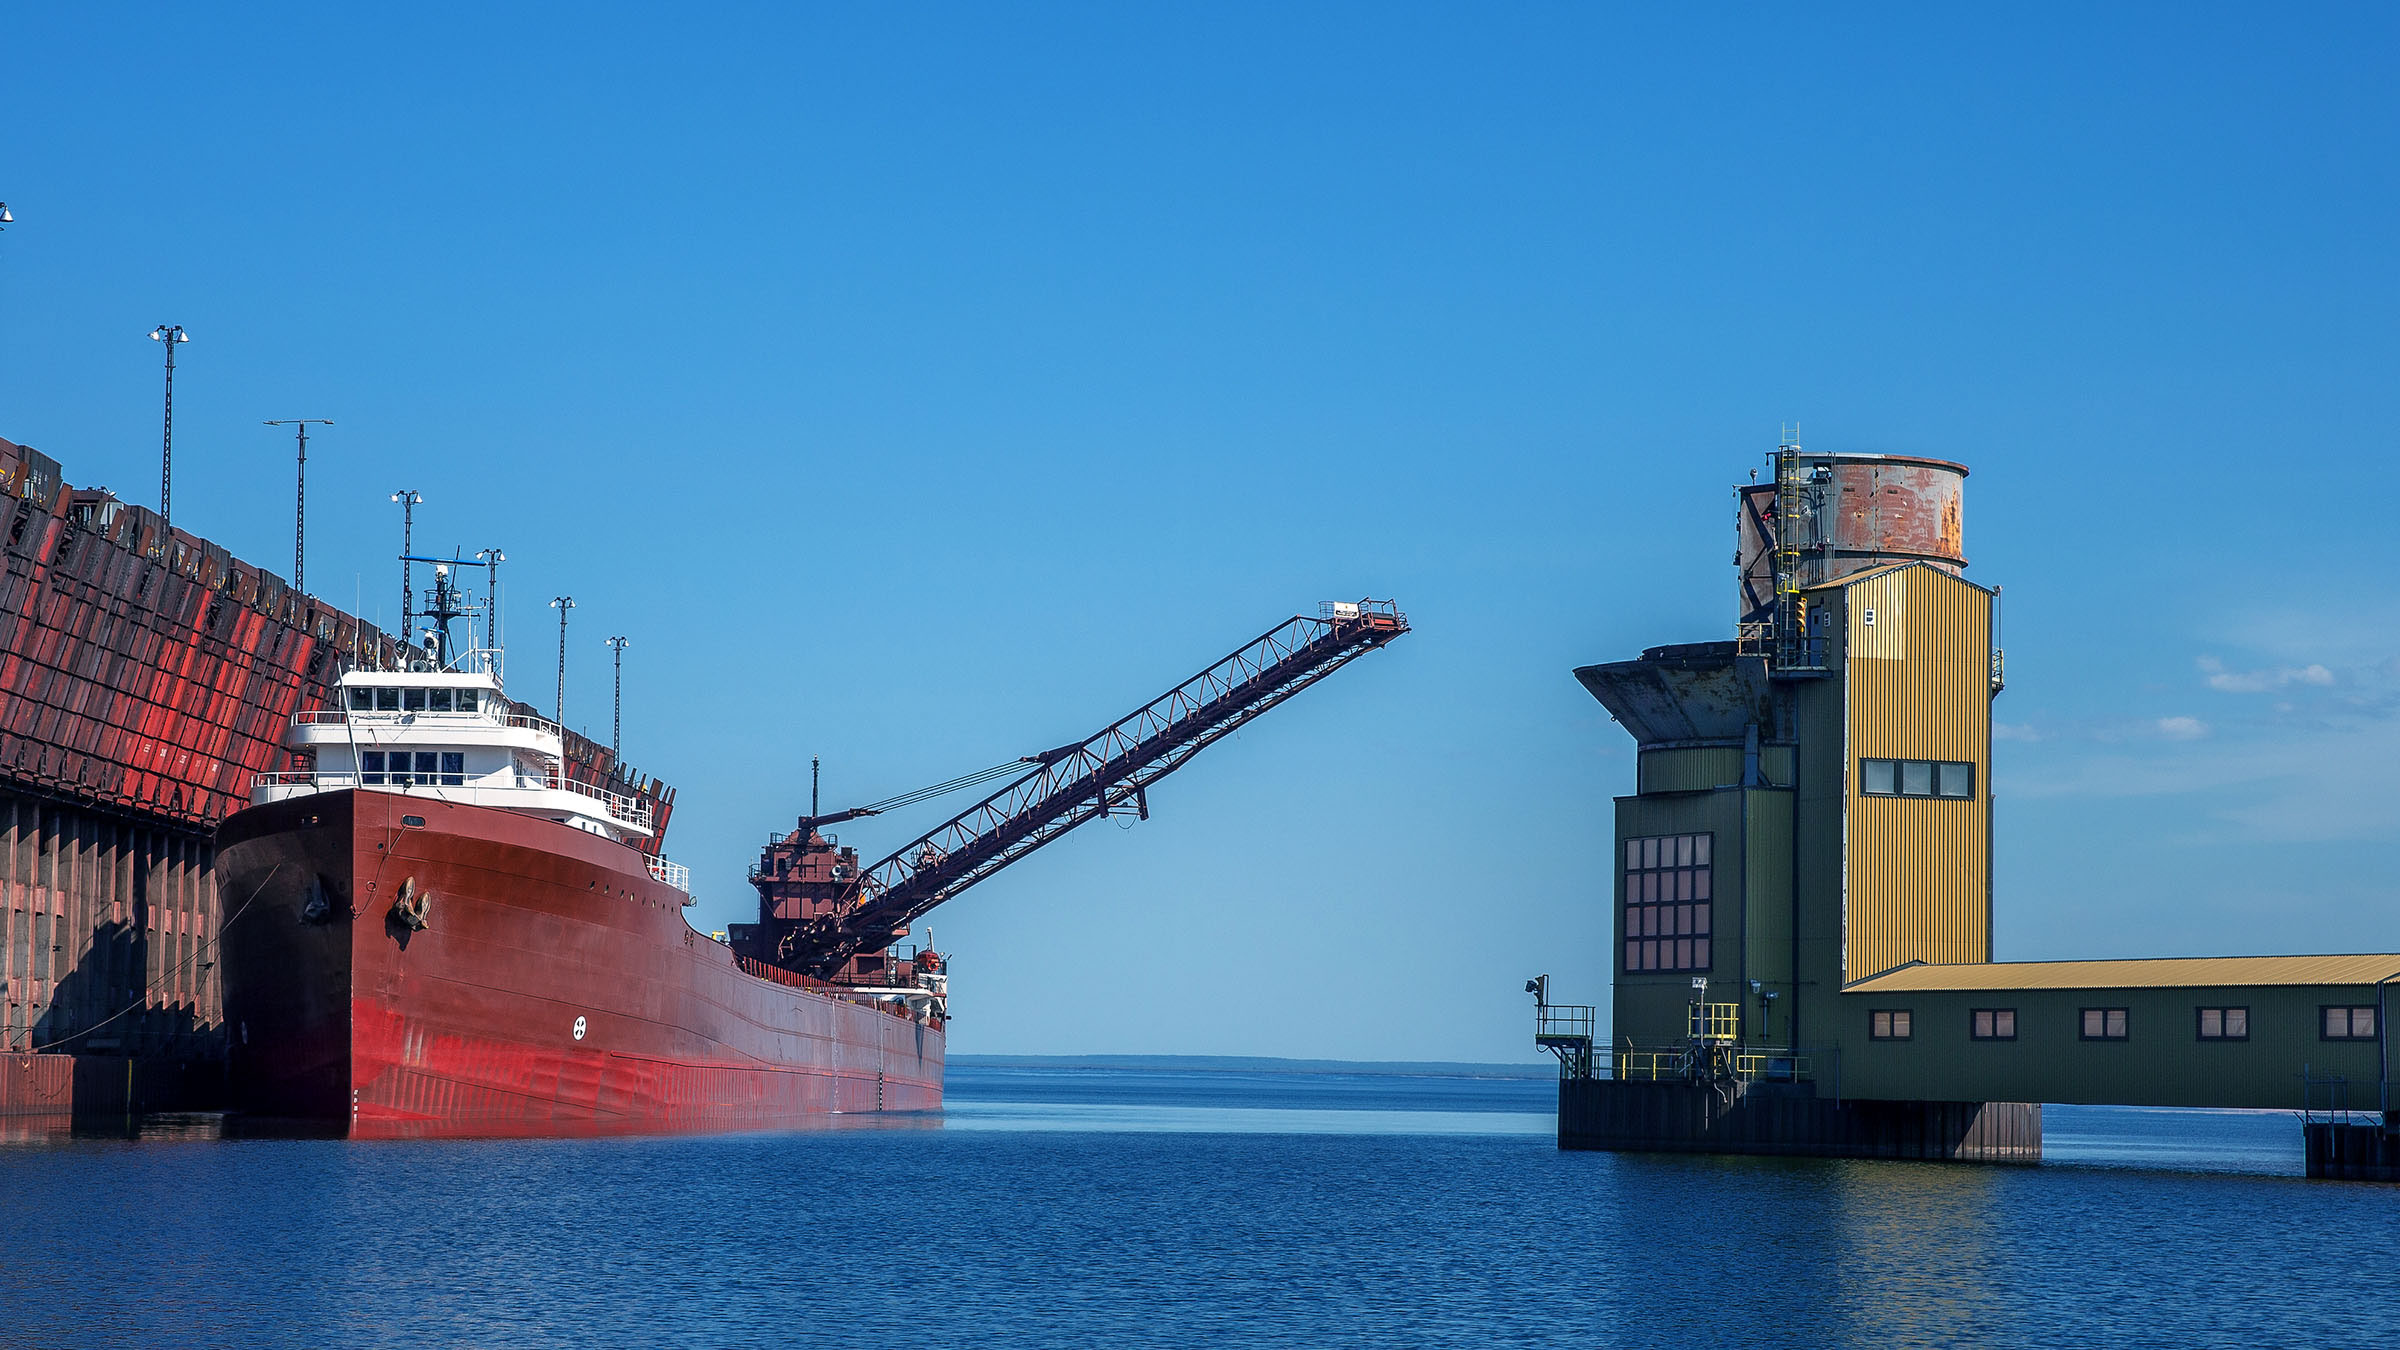
Ninth District manufactured exports tumbled 4.7 percent to $44.4 billion last year, likely due to a strong U.S. dollar and lower demand for goods from major trading partners. Among district states, the value of exports ranged from a 14.5 percent decrease in North Dakota to an almost 2 percent increase in Montana, the only district state that posted gains. Meanwhile, U.S. manufactured exports dropped about 6 percent.
The U.S. dollar strengthened relative to the currencies of major trading partners during 2015, making district exports relatively more expensive in other countries. In addition, economic growth remained sluggish in Canada, Europe and other export destinations.
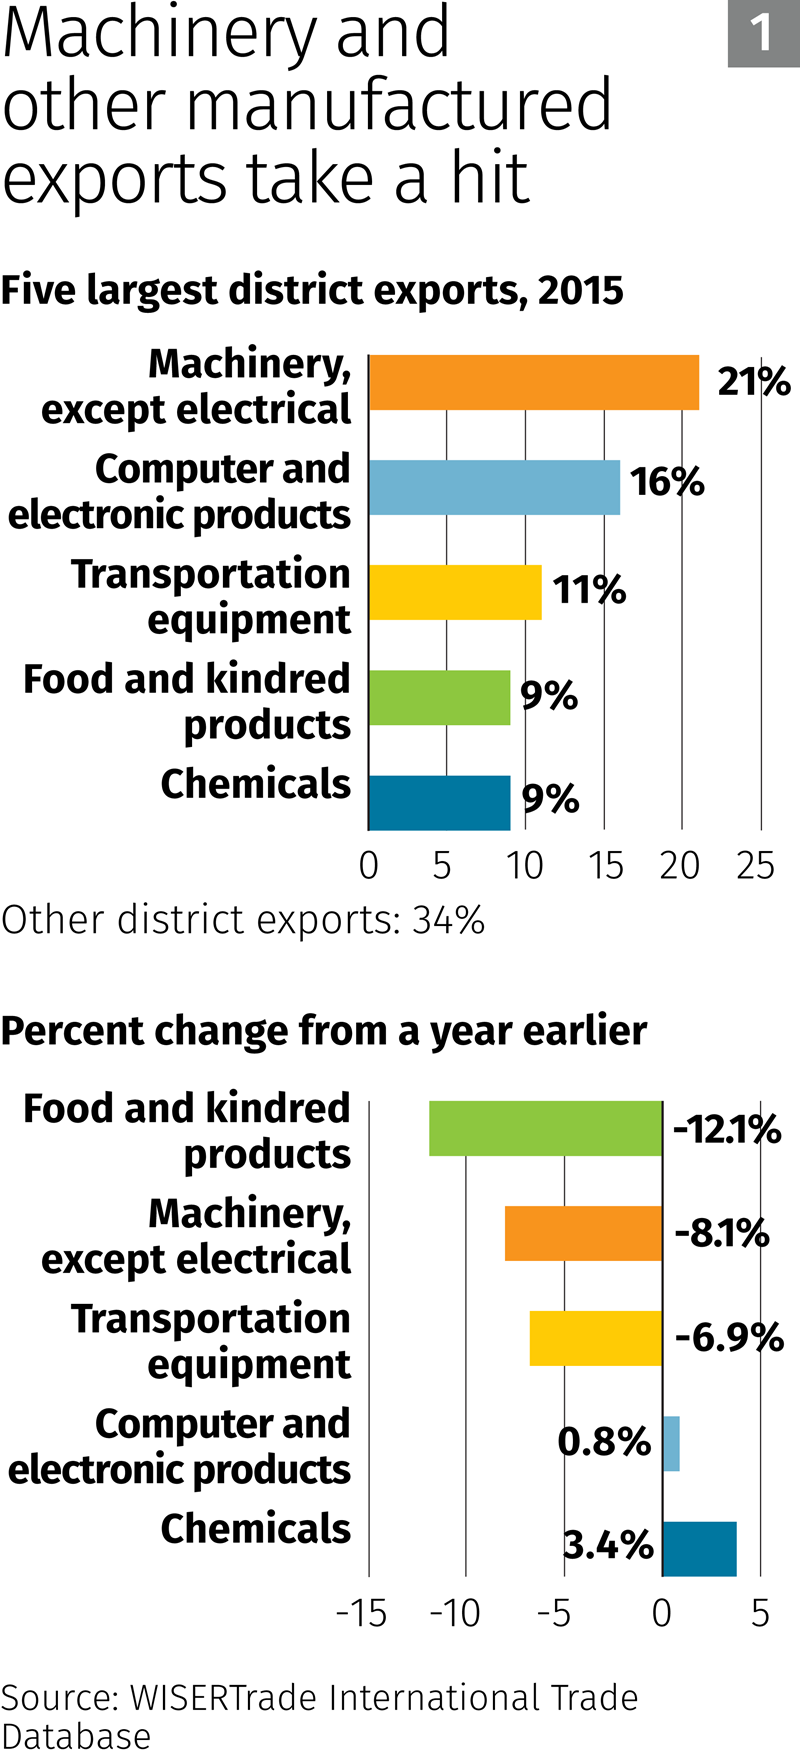
Machinery is the district’s largest export industry, accounting for over 20 percent of foreign sales. District exports in this industry—comprising equipment used in agriculture, construction, power transmission and other economic sectors—fell 8.1 percent in 2015 (Chart 1).
But machinery exports from the district varied considerably by destination. While machinery sales to Canada fell 18 percent, exports to Mexico of that product category increased 34 percent.
The largest component of machinery exports, agriculture and construction, has been on a downward slope—from $5.1 billion in 2012 to $2.8 billion last year. Over that period, prices of agricultural commodities dropped, along with global demand for farm tractors and other implements.
Wisconsin ranks fourth among U.S. states in exports of agricultural and construction machinery, while North Dakota ranks 11th; both states saw declines of over 20 percent.
The district’s second-largest export industry, computer and electronic products, grew less than 1 percent in 2015, while transportation, the third-largest, fell almost 7 percent—primarily due to a drop in motor vehicle exports. Total district exports of motor vehicles decreased 22 percent, while sales to Canada fell by almost one-third
Chemicals, the district’s fifth-largest export industry, provided a bright spot in an otherwise muted export picture; exports grew 3.7 percent in 2015. While exports of machinery to Europe dropped sharply, chemical exports to the Continent increased almost 18 percent.
Weak demand in most countries
Manufactured exports from the region to most global destinations either declined or increased only slightly (Chart 2).
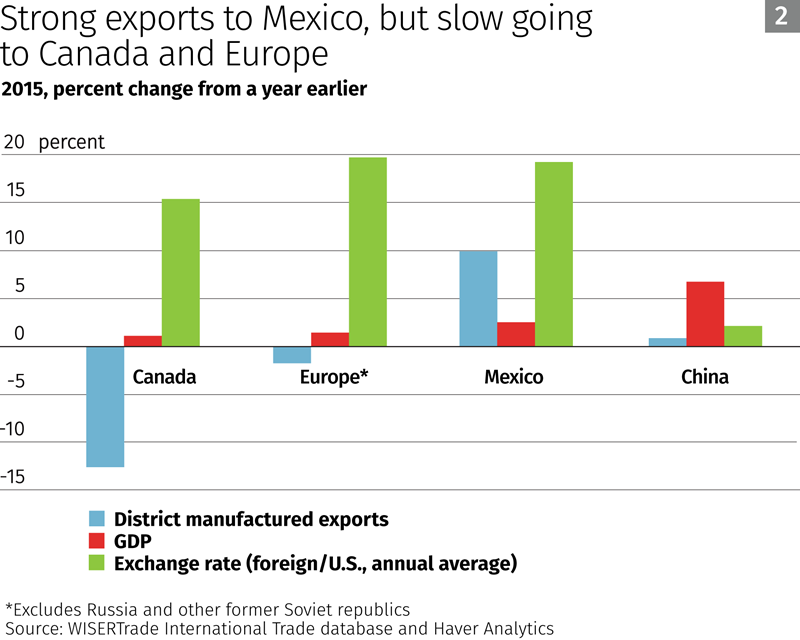
Exports from the region to Canada, the district’s largest export destination, dropped 12.4 percent. Every district state saw declines in northbound sales, ranging from a 25 percent drop in South Dakota to a 7 percent decrease in Montana. Further exchange rate gains by the U.S. dollar against the Canadian loonie—in 2015, the U.S. dollar rose 16 percent to an average of $1.28 Canadian dollars—and minimal economic growth strained exports to Canada.
Exports to the district’s second-largest destination for manufactured exports, Europe, decreased 2 percent in 2015. Exports to Europe fell in all district states, except Montana, which saw a 27 percent increase. The U.S. dollar strengthened against the euro during 2015, rising 20 percent on currency exchanges. And while European economic growth picked up modestly last year, GDP in the region increased only 1.6 percent.
From Billings to Brunei
Last fall, the United States signed an ambitious trade agreement that would lower trade barriers and raise labor and environmental standards in 11 Pacific Rim countries with a combined population of 490 million. Under the terms of the Trans-Pacific Partnership, current U.S. Free Trade Agreement partners such as Canada, Mexico and Singapore would remove taxes on many U.S. exports and ease restrictions on service firms doing business in foreign markets.Read more
District manufacturers saw anemic sales growth of only 1 percent in the four Asian newly industrialized economies of Hong Kong, Singapore, South Korea and Taiwan, the district’s fourth-largest manufactured export destination. Exports were similarly weak to China, the fifth-largest destination. Ten years ago, China’s economic output was surging at a 13 percent annual pace; while GDP in China is still growing faster than in many other industrialized countries, it continued to slow in 2015, rising 7 percent.
Mexico bucked the overall lackluster trend in district manufactured exports, as it did in 2014. Mexico, the district’s third-largest export destination, posted the greatest export gains last year. District exports across the U.S. southern border grew almost 10 percent despite a 19 percent rise in the U.S. dollar relative to the Mexican peso.
Exports to Mexico from South Dakota and Minnesota increased the most—23 percent and 16 percent, respectively—while sales to Mexico decreased 13 percent in North Dakota and 30 percent in Montana.
Manufacturing sector slows
As district exports slid lower, manufacturing as a whole showed signs of weakness. According to Creighton University’s monthly survey of supply managers, manufacturing activity slackened during 2015 in Minnesota, North Dakota and South Dakota. The survey indicated that manufacturing activity was expanding at the beginning of the year, but pointed to contraction in all three states by year’s end.
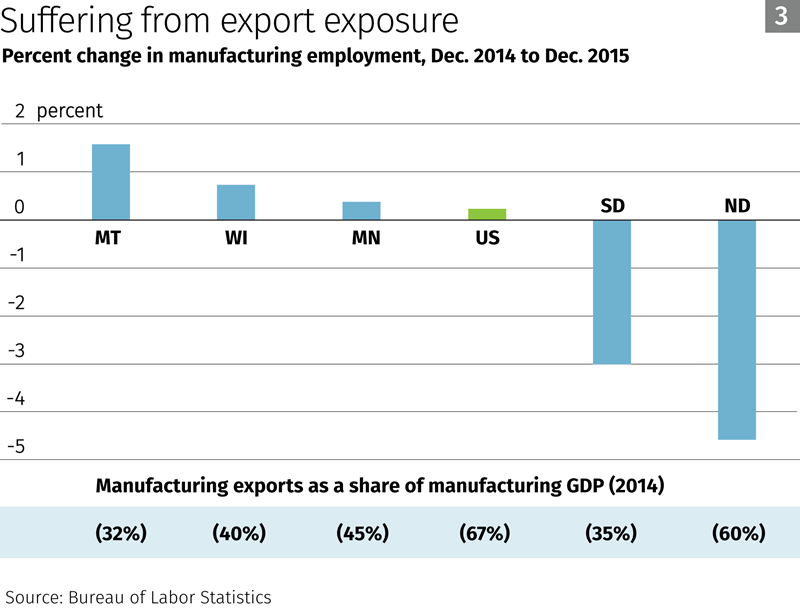
In addition, manufacturing employment in the district either grew weakly or decreased over the course of the year (Chart 3). The exception was Montana, where employment increased 1.6 percent. Among district states, manufactured exports vary as a share of state manufacturing GDP, ranging from about one-third in Montana and South Dakota to 60 percent in North Dakota.
| Total Exports 2015 ($ millions) | Annual Percent Change 2014-2015 | |
|---|---|---|
| Minnesota | ||
| Europe | 4,253.0 | -2.5 |
| Canada | 4,096.0 | -16.6 |
| Mexico | 2,194.5 | 16.0 |
| Asian NIEs* | 2,048.4 | 0.7 |
| China | 1,685.6 | 2.1 |
| Total | 18,883.1 | -4.5 |
| Montana | ||
| Canada | 432.0 | -7.2 |
| Europe | 172.8 | 27.4 |
| Asian NIEs* | 136.7 | -10.7 |
| China | 106.4 | 35.8 |
| Japan | 51.6 | 2.2 |
| Total | 1,046.6 | 1.8 |
| North Dakota | ||
| Canada | 1,254.4 | -20.4 |
| Europe | 179.1 | -1.8 |
| Mexico | 141.6 | -12.7 |
| Pacific Islands | 135.9 | 55.2 |
| South America | 41.9 | -8.1 |
| Total | 1,921.3 | -14.5 |
| South Dakota | ||
| Canada | 502.8 | -24.7 |
| Mexico | 371.7 | 22.5 |
| Europe | 106.7 | -10.7 |
| Middle East | 102.6 | 28.8 |
| Pacific Islands | 52.2 | 2.3 |
| Total | 1,311.5 | -10.7 |
| Wisconsin | ||
| Canada | 6,826.6 | -7.2 |
| Europe | 3,827.9 | -2.1 |
| Mexico | 2,813.6 | 6.2 |
| China | 1,454.0 | -1.9 |
| South America | 1,185.5 | -17.1 |
| Total | 21,195.4 | -3.7 |
| *Asian NIEs (newly industrialized economies) include Hong Kong, Singapore, South Korea and Taiwan. | ||
| Total Exports 2015 ($ millions) | Annual Percent Change 2014-2015 | |
|---|---|---|
| Minnesota | ||
| Computer and electronic products | 3,530.2 | -6.9 |
| Machinery, except electrical | 3,278.9 | 3.7 |
| Transportation equipment | 2,255.2 | -12.5 |
| Miscellaneous manufactured commodities | 2,204.5 | 4.2 |
| Food and kindred products | 1,561.2 | -11.7 |
| Total | 18,883.1 | -4.5 |
| Montana | ||
| Chemicals | 325.7 | 4.3 |
| Machinery, except electrical | 153.8 | 22.9 |
| Beverages and tobacco products | 111.1 | 97.1 |
| Nonmetallic mineral products | 85.3 | 0.4 |
| Transportation equipment | 59.4 | -10.0 |
| Total | 1,046.6 | 1.8 |
| North Dakota | ||
| Machinery, except electrical | 780.9 | -18.6 |
| Chemicals | 257.2 | -14.7 |
| Petroleum and coal products | 237.8 | -21.3 |
| Food and kindred products | 225.3 | 14.2 |
| Transportation equipment | 113.8 | -25.4 |
| Total | 1,921.3 | -14.5 |
| South Dakota | ||
| Food and kindred products | 413.3 | -24.9 |
| Machinery, except electrical | 315.1 | -4.5 |
| Transportation equipment | 162.1 | -3.2 |
| Computer and electronic products | 115.0 | -17.3 |
| Beverages and tobacco products | 95.9 | 48.8 |
| Total | 1,311.5 | -10.7 |
| Wisconsin | ||
| Machinery, except electrical | 4,667.6 | -14.0 |
| Computer and electronic products | 3,247.5 | 11.8 |
| Transportation equipment | 2,176.3 | 1.0 |
| Chemicals | 2,127.8 | 5.8 |
| Food and kindred products | 1,912.8 | -11.6 |
| Total | 21,195.4 | -3.7 |