Authors


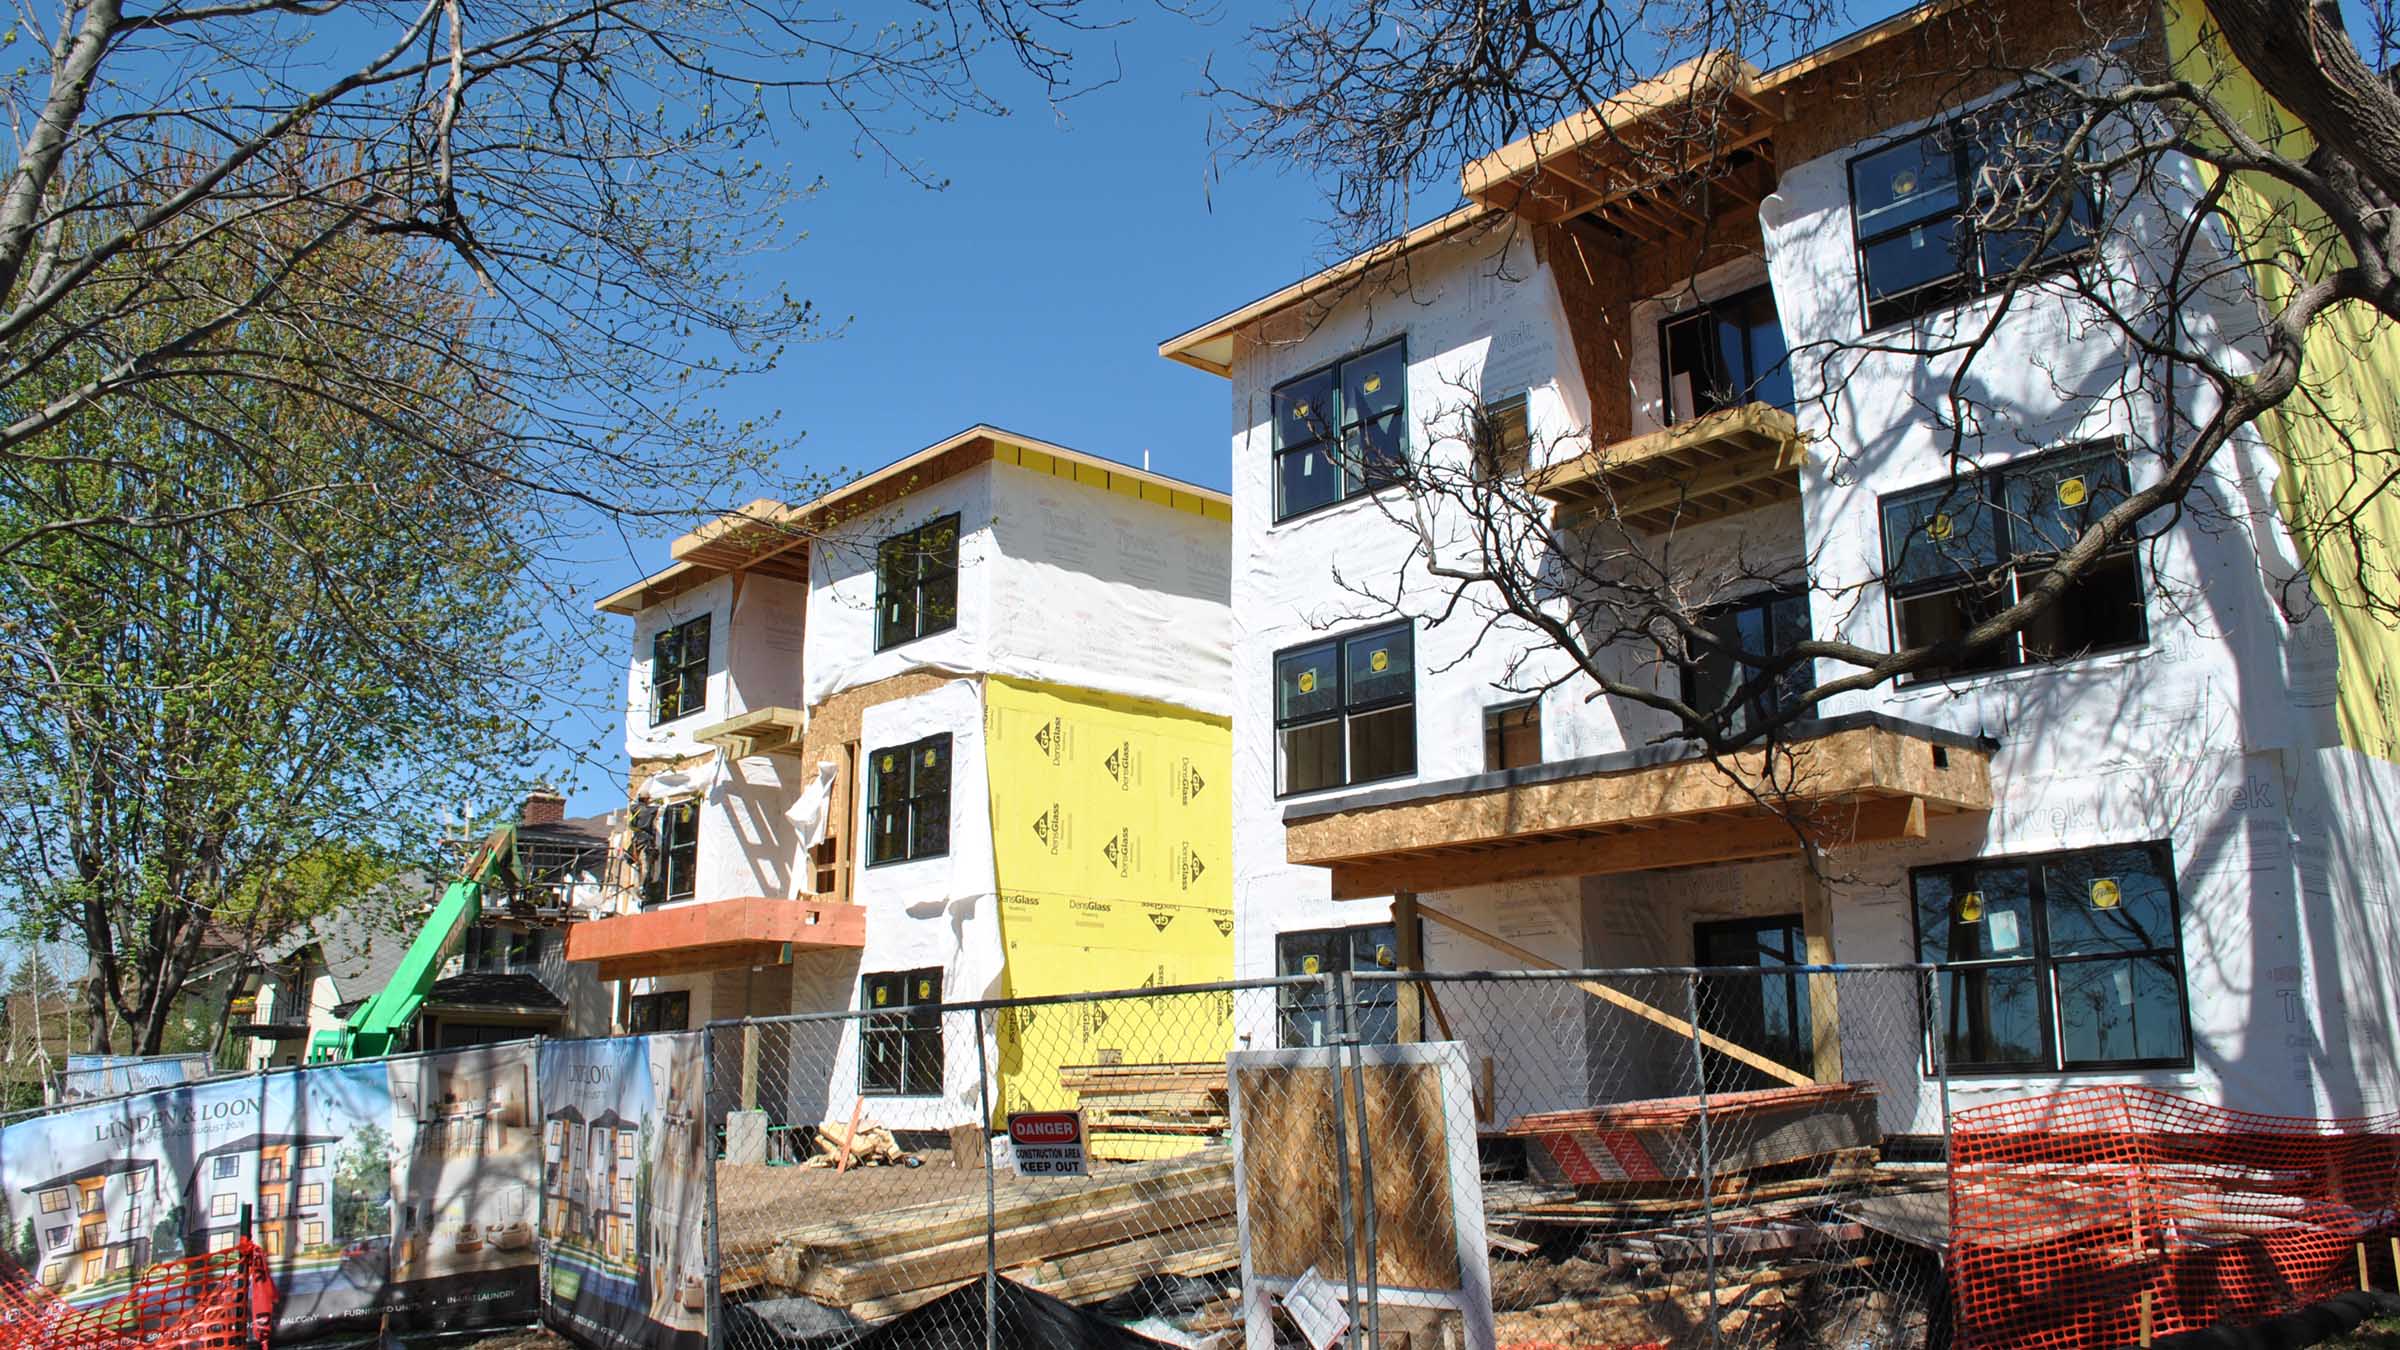
When the housing market collapse began in earnest nearly a decade ago, two related narratives emerged. One was about misfortune—the financial distress and domestic upheaval that many families endured with the loss of their homes. The other was about opportunity, as purchasers took advantage of the swelling inventory of foreclosed homes. The Federal Reserve Bank of Minneapolis recently examined this second narrative by looking closely at purchases of foreclosed properties. Specifically, we looked at the financing people used to purchase foreclosed properties in the years including and following the collapse. Because mortgage lending standards tightened during this time, people with the ability to pay cash became the prevailing property buyers in neighborhoods where individuals with less-than-stellar credit had been buying homes leading up to the housing crash. We were interested in exploring the level of cash purchase activity in the Twin Cities and where, specifically, this activity was prevalent. To conduct our analysis, we explored MLS (Multiple Listing Service) and county registry of deeds data provided by market-tracking firm CoreLogic. Our analysis focused on Minneapolis and St. Paul because of the large volume of dwellings within these cities as well as the preponderance of foreclosures that occurred there during the housing bust.
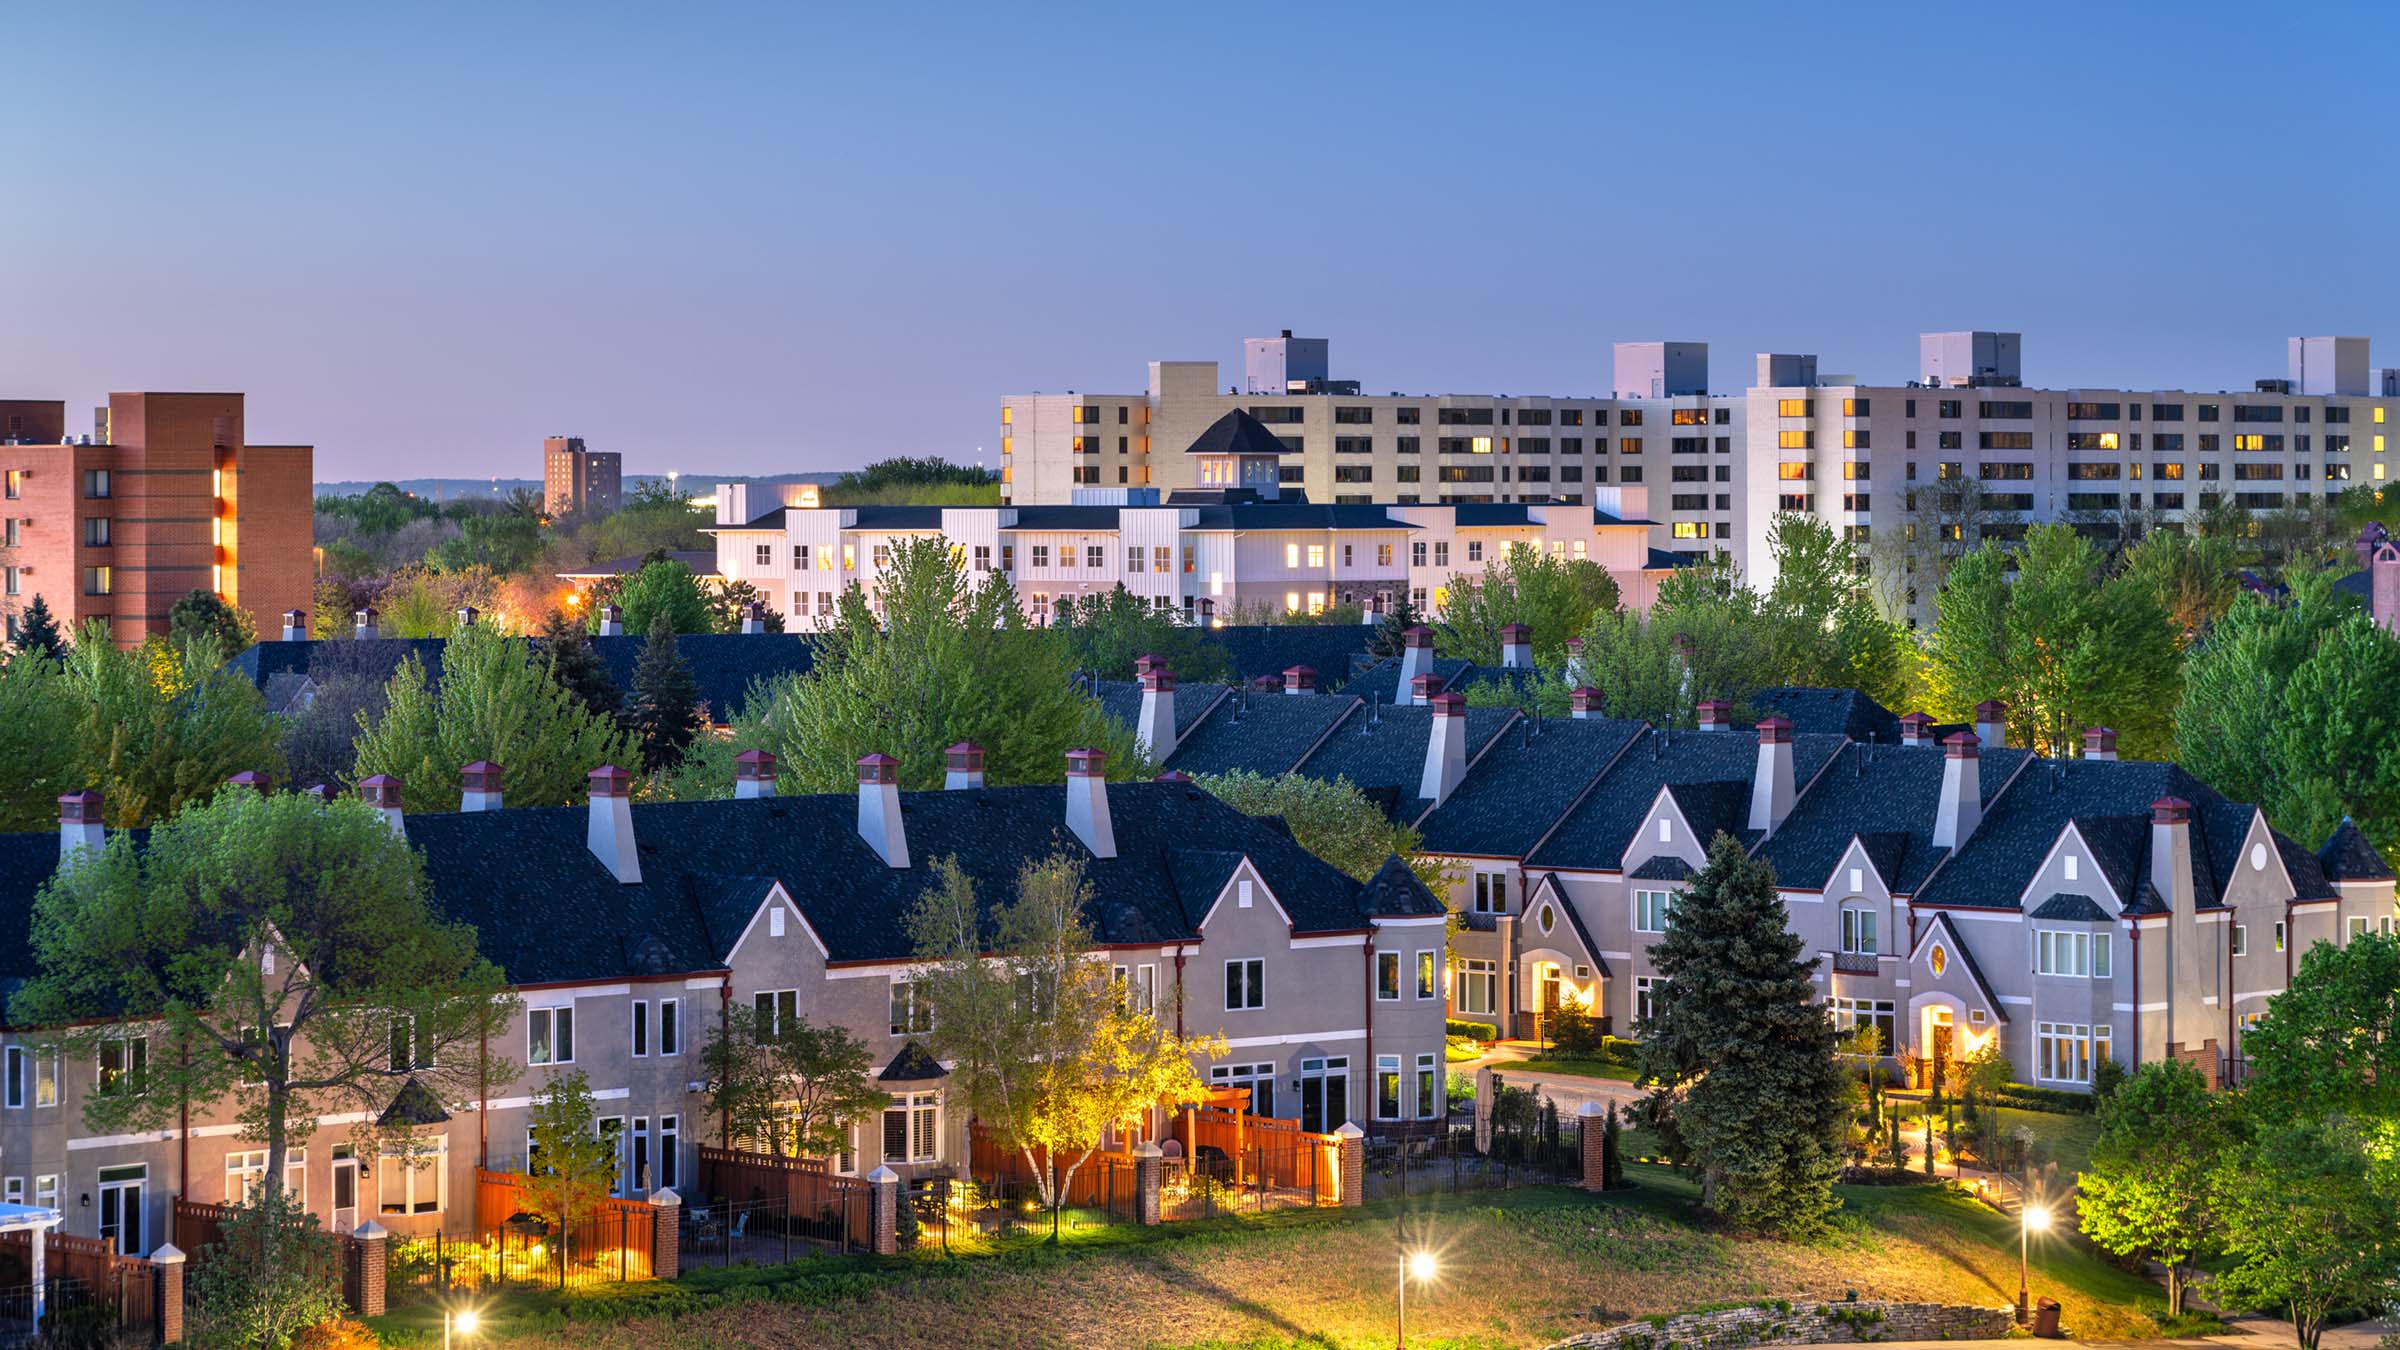
Where cash sales are concentrated
Methodology
The sales transaction data used for this analysis comes from MLS and county registry of deeds datasets provided by CoreLogic. These data include parcel identifiers that make merging records for parcels possible. We used the MLS data to determine whether the transaction was an REO sale, as they consistently included closing prices. The deed data reported the sale price less frequently but were a good source for other information, such as indicators of owner occupancy and financing method (e.g., cash or mortgage). Read more
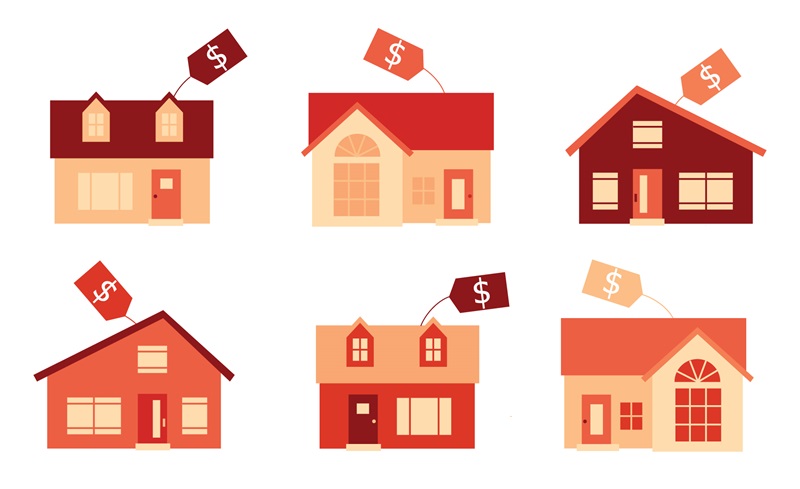
In Minnesota as a whole, people who purchased foreclosed homes largely did so with traditional financing: our calculations, based on the CoreLogic data indicate that from 2008 to 2014, 56 percent of REOs—that is, real estate owned properties, or foreclosed properties whose ownership transfers back to the financial institution that made the mortgage loan—were purchased by people who paid for them with a loan from a mortgage lender. The remaining 44 percent of acquisitions, however, were paid for with cash, particularly those homes whose sticker price fell below $50,000. In Minneapolis and St. Paul, the figures are almost exactly reversed; 58 percent of REO purchases over the same period were made in cash and 42 percent were made with mortgage loans.
Many people who purchase homes upfront with cash do so in order to live in them mortgage-free. But an alternate scenario is the purchase of a foreclosed home without the intention of living in it. Often, these are purchases by people who are looking to earn an attractive rate of return by renting out the home.
In the Twin Cities metropolitan statistical area (MSA), which comprises the 16 counties that include and surround Minneapolis and St. Paul, foreclosures peaked in late 2010, with 2.25 percent of mortgages in foreclosure, compared to a historical norm of about 0.25 percent and levels today just under 0.5 percent. At the center of the Twin Cities MSA, in the cities of Minneapolis and St. Paul, these foreclosures and resulting REOs, while affecting just about every neighborhood, were most prevalent in three particular ZIP Codes: 55106, in East St. Paul; and 55411 and 55412, in North Minneapolis.
These areas also had the highest numbers of cash sales. Of the roughly 19,000 REO sales in Minneapolis-St. Paul proper between 2008 and 2014, more than a quarter occurred in the three ZIP Codes in question. Within these ZIP Codes, 29 percent of the REO homes were subsequently purchased through traditional financing channels, while the remaining 71 percent were purchased with cash. At their peak, cash sales of REOs where the buyer does not appear to occupy the property1 made up 4 of every 10 acquisitions (41 percent) in St. Paul’s 55106 ZIP Code. In North Minneapolis’s 55411 and 55412 ZIP Codes, the share of these types of cash purchases was closer to 5 of every 9 acquisitions (57 percent). While we cannot be certain that all of these properties were then rented out, we assume that a large portion of them were.
With regard to price, the data reveal that the median sales price was very low for these types of cash acquisitions. Over the period from 2008 through 2014, the median sales price was $33,000 in North Minneapolis’s 55412 ZIP Code and closer to $29,000 in the 55411 ZIP Code. In St. Paul’s 55106 ZIP Code, the figure was just over $45,000.
What time and data might tell
The two narratives of the housing crash played out starkly in these three ZIP Codes, with homeowners there losing nearly 5,000 homes to foreclosure between 2008 and 2014 and many hundreds of the foreclosed homes subsequently bought up by rental-income-seeking investors. Moreover, the ratio of investment purchases to owner-occupied purchases was higher in these three ZIP Codes during this timeframe than in the remaining areas of the central cities. But while some of the investment properties continue to be rented out by the new owners, others have surely been resold to people seeking to make them their homes. What remains to be seen is when and if these communities will return to their pre-housing crash conditions, especially the historical ratio of renters and homeowners. Over time, researchers and policymakers will need to assess these and other data in order to monitor the trajectories of these communities.
Endnote
* CoreLogic compared the mailing address and property address to determine whether the property was owner-occupied following the transaction.