Author


A number of studies show that young children grow up in families with a wide range of incomes and that differences in family socioeconomic conditions are associated with differences in reading scores in kindergarten and achievement gaps during elementary and secondary school.
According to family income data from the American Community Survey, U.S. families in the 10th percentile of family income with children under age 6 have 15 times less annual income than children in the 90th percentile of income. In addition, median income for families with young children is almost 20 percent lower than median income for all families.* Parents with young children are usually in the early stages of their careers and, on average, have lower earnings compared to parents with older children.
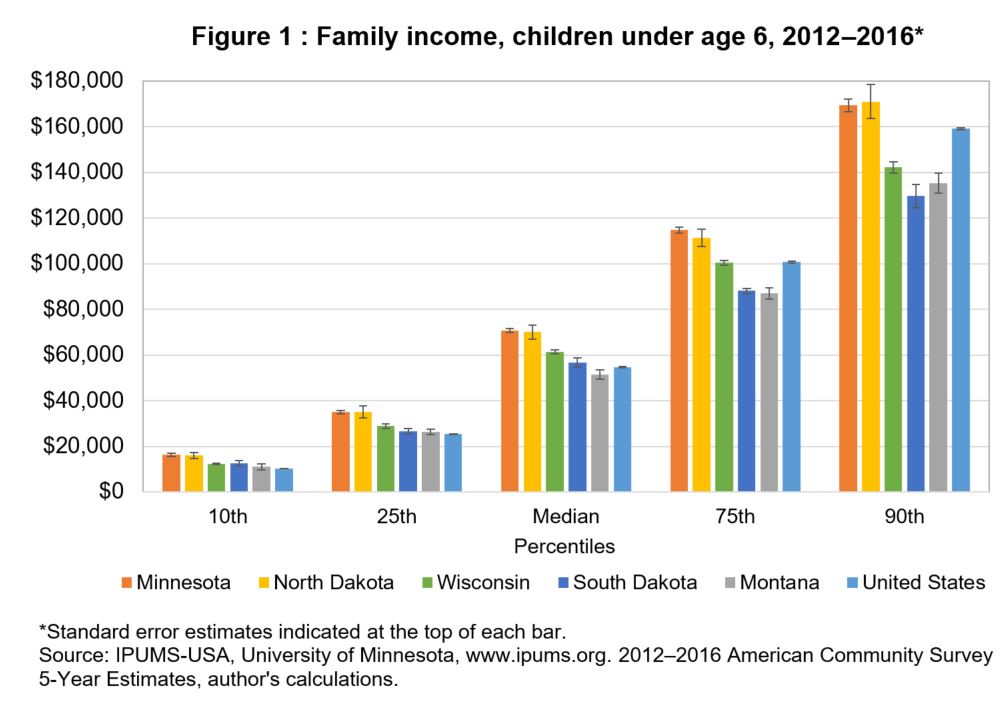
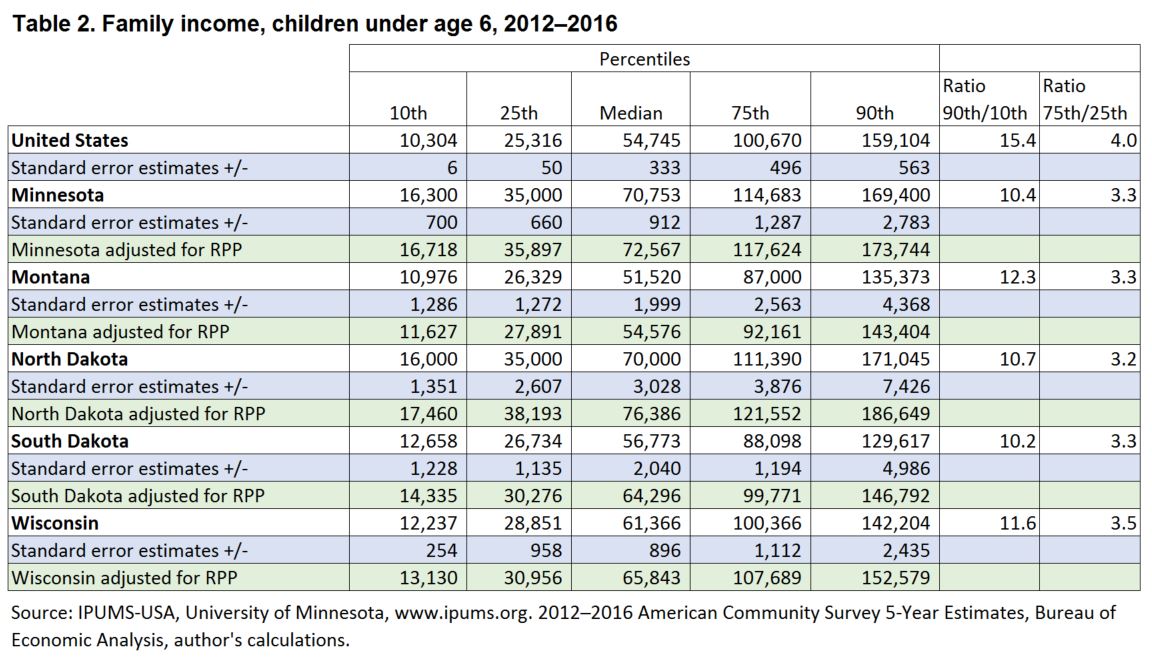
Ninth Federal Reserve District states follow general trends at the national level, with some differences. The ratio of the 10th percentile to the 90th percentile of incomes of families with young children is smaller than that of the nation, but still relatively wide, ranging from just over 10 times in South Dakota and Minnesota to over 12 times in Montana.
Family income levels vary across Ninth District states, with Minnesota and North Dakota having the highest levels of income and Montana and South Dakota the lowest levels (see Figure 1, Michigan is not included in the analysis).
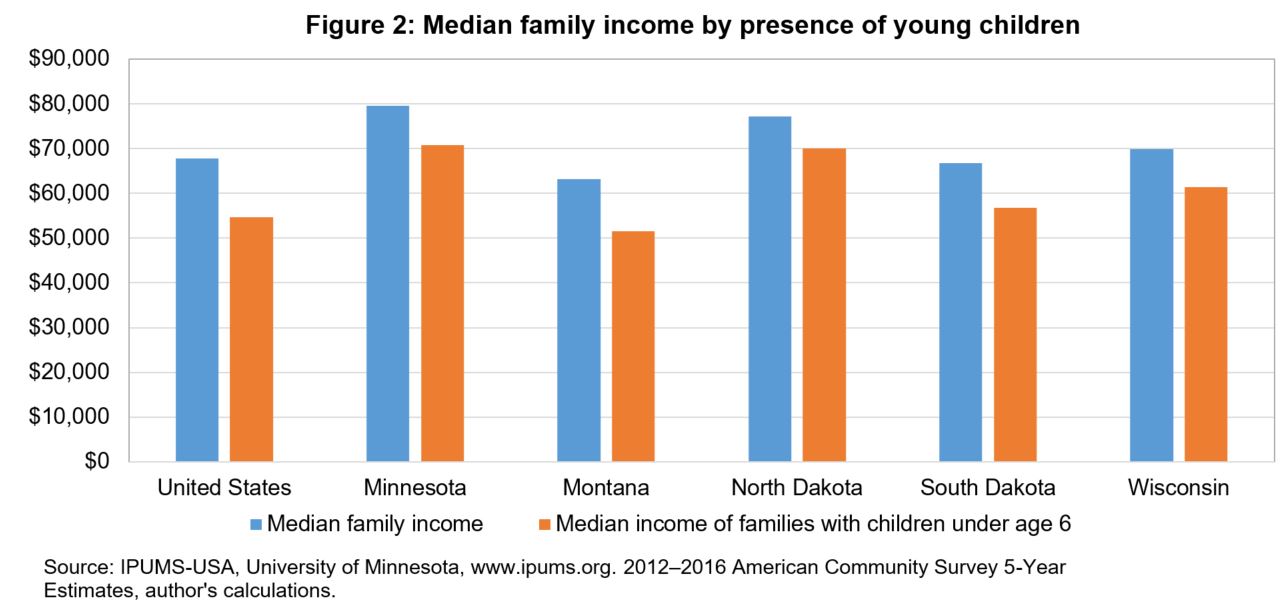
As in the nation as a whole, families with young children in the Ninth District have lower income levels than all families; however, the difference between median income for all families and that of families with young children is smaller in the Ninth District (see Figure 2).
The tables and explanation of data and methodology below provide more details.
Data and methodology
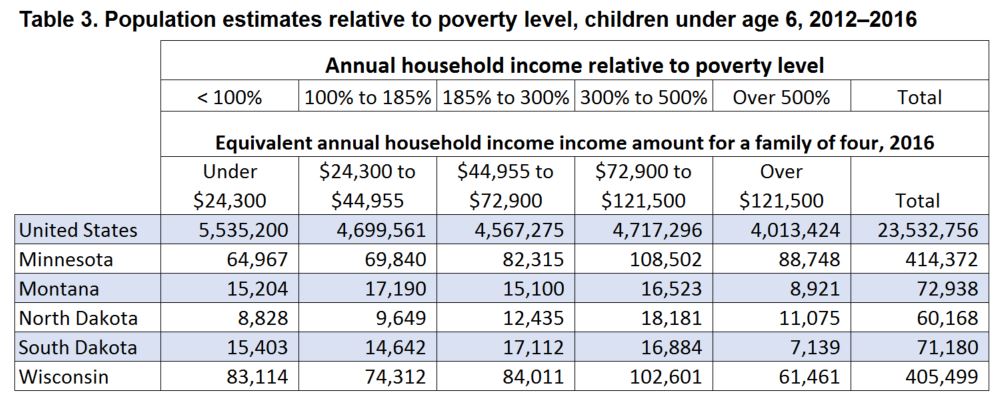
Data are from IPUMS-USA, 2012–2016 American Community Survey (ACS) 5-year sample, which contains all households and persons from the 1 percent ACS samples for 2012, 2013, 2014, 2015, and 2016 identifiable by year. Data are limited to children under age 6. Each child’s record includes a person weight that can be used to create weighted sample values that represent the full population of children under age 6.
For each geography (United States and five Ninth District states), the data are sorted by the annual income of the child’s family. Then, starting at the bottom, a cumulative sum of person weights is calculated. The 10th, 25th, 50th, 75th, and 90th percentiles of the cumulative sum are estimated by multiplying the total cumulative person weight by .1, .25, .5, .75, and .9, respectively. Each percentile is then assigned the family income of the individual child whose cumulative person weight value is closest to the estimated percentile value.
IPUMS-USA replicate weights are used to calculate standard errors based on these instructions. Sample sizes for Montana, North Dakota, and South Dakota are relatively small compared with those for Minnesota and Wisconsin; therefore, the findings are less precise, as indicated by standard error estimates.
*The median is the midpoint value in an ordered set in which half of the values are above and half are below. Percentile refers to a value on a scale of 100 that indicates the share of a distribution equal to or below it. For example, at the 75th percentile, 75 percent of values in the ordered set are at or below the value and 25 percent are above.