Authors


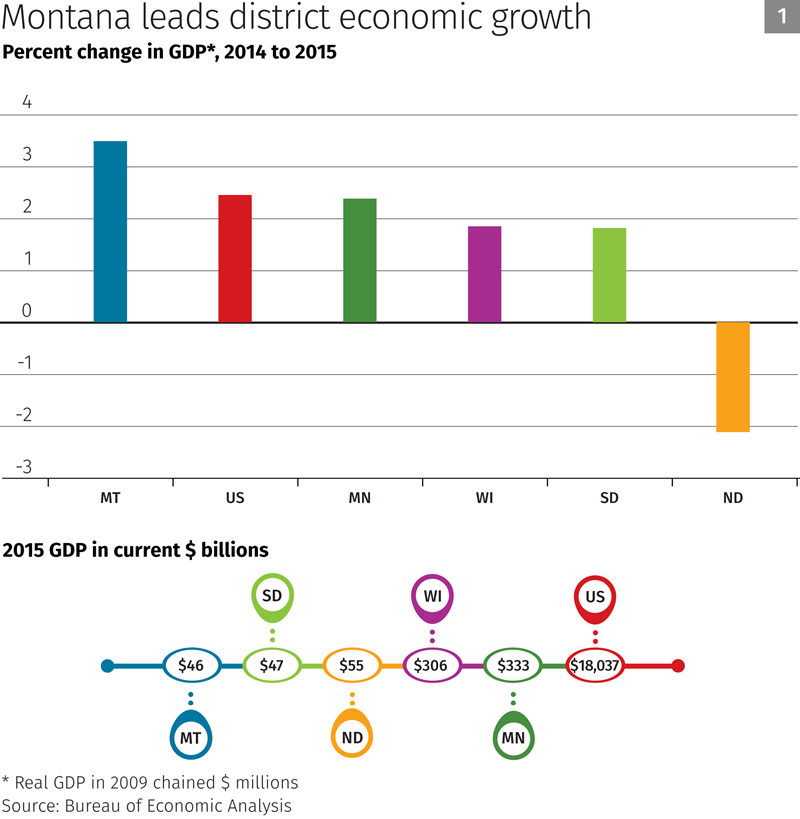
The Ninth District’s economic output increased in 2015, but at a slower pace than that of the nation as a whole. District gross domestic product—the total value of goods and services produced in the region—grew 1.9 percent year over year, while GDP increased 2.4 percent nationally. Among five district states, Montana posted gains greater than the national average, while other district states grew more slowly. North Dakota’s GDP declined by more than 2 percent (see Chart 1), due largely to slumping oil and gas production.
(Economic output varies widely among district states. In 2015, Minnesota had the largest GDP at $333 billion, while Montana had the smallest at $46 billion.)
The information sector had the largest GDP growth in the district at 6 percent (see Chart 2). The next-strongest sectors included construction, agriculture and forestry, and professional and business services. Government decreased slightly, while mining plummeted 9 percent.
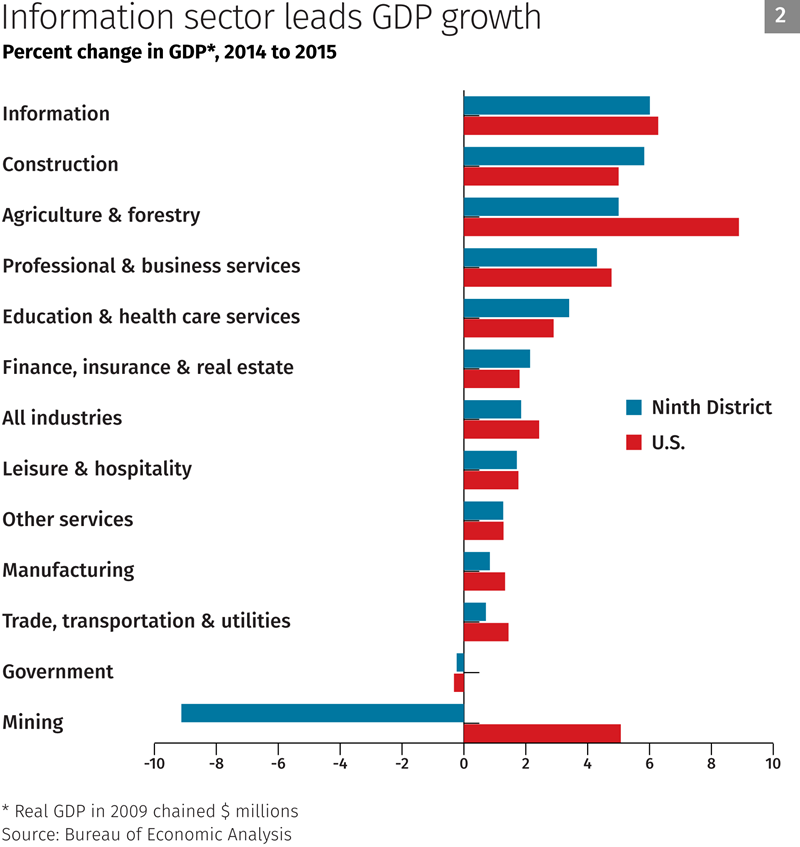
Continued low metal and oil prices have softened mining activity in the district over the past year, more so than in the country as a whole, which saw GDP increase in real terms. Iron mining and oil and natural gas extraction make up a substantial share of mining activity in the district, and both industries have retrenched. Oil drilling and production declined dramatically in western North Dakota and eastern Montana.
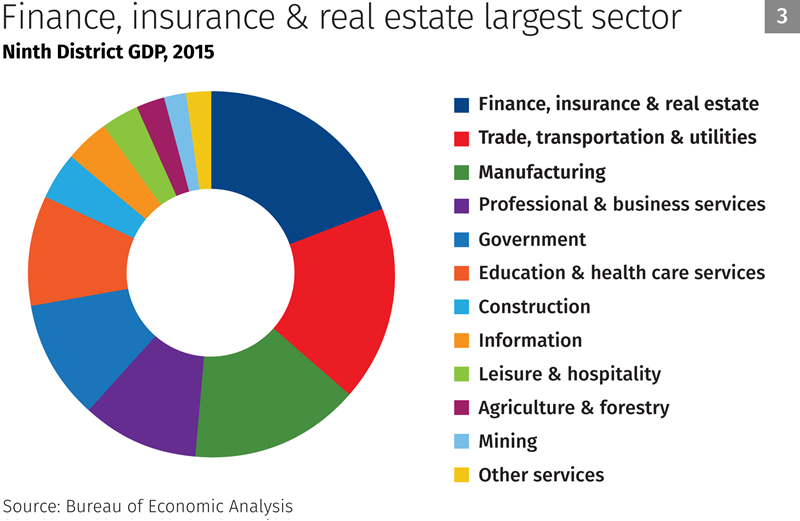
With the exception of professional and business services, sectors that make up the bulk of the district economy experienced modest growth. For example, finance, insurance and real estate generated 19 percent of district output last year, but GDP for the sector rose only 2.1 percent (see Chart 3 for a breakdown of the relative contribution of each sector to district GDP).